


Charted: Commodities vs Equity Valuations (1970–2023)
Graph: What is a Commodity Supercycle?

Charted: Commodities vs Equity Valuations (1970–2023)
In recent years, commodity prices have reached a 50-year low relative to overall equity markets (S&P 500). Historically, lows in the ratio of commodities to equities have corresponded with the beginning of new commodity supercycles.
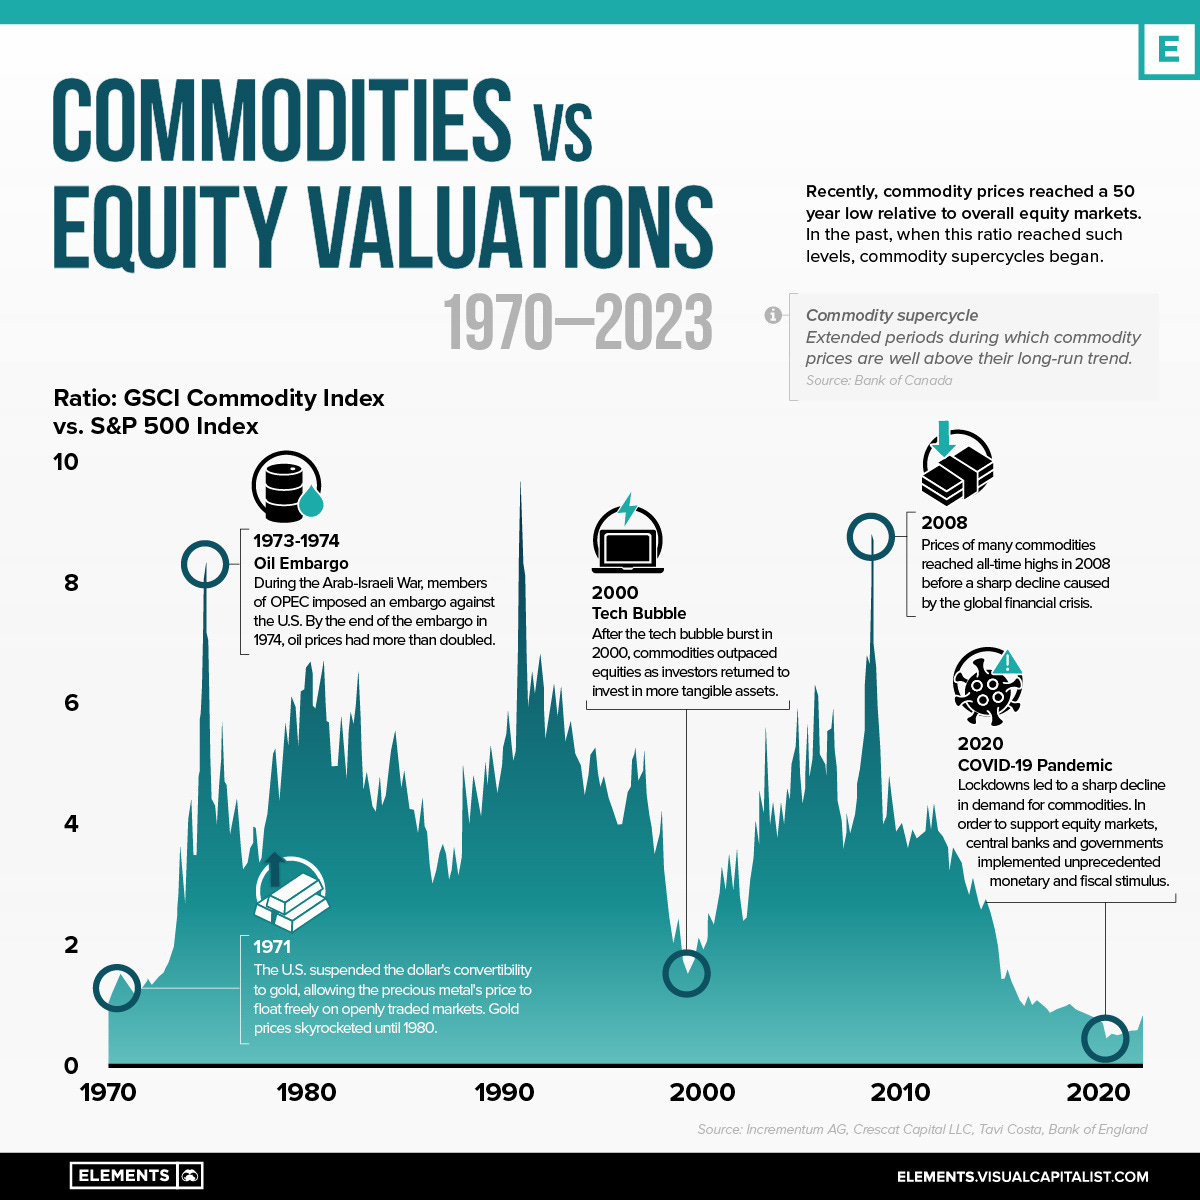
The infographic above uses data from Incrementum AG and Crescat Capita…