
Paper: Forecasting Silver Demand by 2030
Impact of silver-intensive photovoltaic cells and sectoral competition

Authors:
Vittoria Cattaneo a b, Justine Mast a, Isadora Hackenhaar a, Steve Nardone b, Stijn Scheerlinck b, Jan Mertens c d, Jo Dewulf a 1
Published on: Science Direct
Abstract
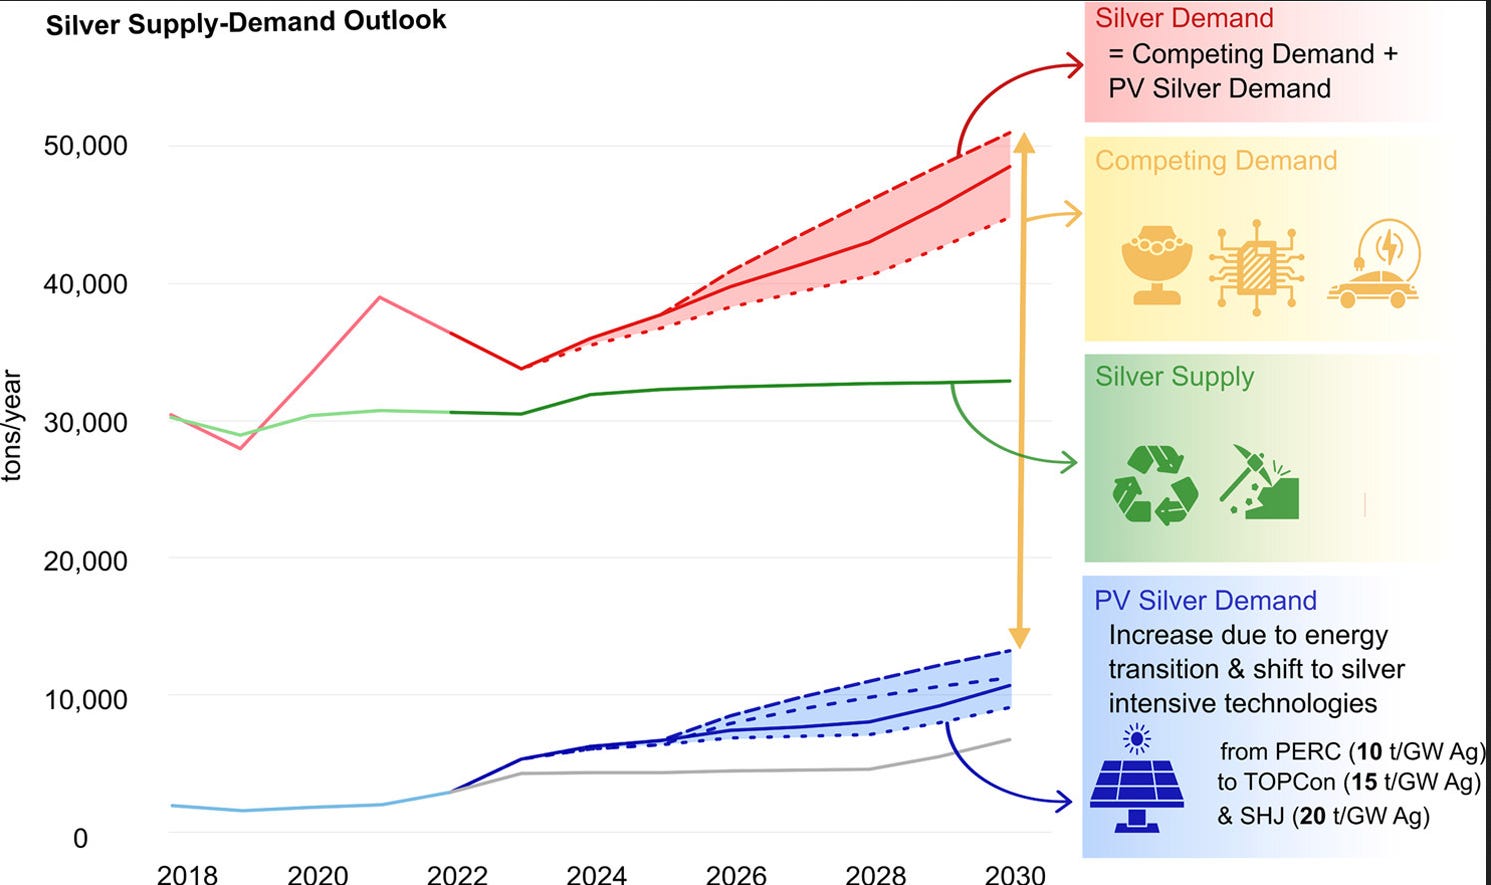
The availability of raw materials is a key challenge for the expansion of solar energy to the levels needed to mitigate climate change. Therefore, understanding material demand and supply chains is crucial to avoid bottlenecks and enable the transition to sustainable energy. This research examines the global silver requirements of the photovoltaic industry under various deployment and technology trends, along with silver demand from competing industries, to provide a comprehensive supply-demand outlook. The results indicate that by 2030, supply may meet only 62–70 % of demand, which is projected at 48,000–54,000 t/y. The solar industry is expected to be the fastest-growing source of silver demand, reaching 10,000–14,000 t/y (29–41 % of supply). Despite slower growth, demand from competing sectors may rise to 38,000–40,000 t/y. As 72 % of primary silver is produced as co-product, significant expansion of primary output by 2030 is unlikely. Reducing silver consumption in all applications, identifying suitable substitutes, and expanding secondary production are essential to mitigate supply risks.
Graphical abstract

Introduction
Over the past 50 years, the global photovoltaic (PV) market has been growing consistently, basically doubling its size every three years (Haegel et al., 2023). The expansion of the sector has been particularly remarkable since the early 2010s, with global PV installed capacity going from just 40 GW in 2010 to 1 TW in 2022 and 2 TW in 2024, far exceeding installation roadmaps and projections (Hoekstra et al., 2017; IEA, 2023b; IRENA, 2024; Solar Power Europe, 2024). Substantial advancements have been made also on the technology side, leading to significant improvements in the efficiency of PV systems and decreasing the cost of PV-generated energy by 90 % in the last 12 years, thus making PV the most cost-effective energy source in many regions (IEA, 2023d). This strong growth trajectory is anticipated to continue and even accelerate, with PV expected to play a key role in the energy transition and the reduction of energy-related emissions. In particular, to meet the global objective of limiting the rise in average temperatures to 1.5 °C by the end of the century, it is estimated that global PV capacity will need to reach between 18 and 63 TW by 2050, as shown in Fig. 1 (Bogdanov et al., 2021; IEA, 2023d; UNFCCC, 2015).
In order to support the expansion of PV capacity on such a large scale, raw material availability has emerged as a critical challenge (Haegel et al., 2023). Although clean energy technologies require less mining over their entire lifecycle, their manufacturing is significantly more resource-intensive, requiring larger quantities and a wider range of materials compared to traditional fossil fuel-based systems (IEA, 2021; Ritchie, 2024). As a result, the energy transition is expected to drive demand for a variety of minerals and metals to unprecedented levels, increasing the likelihood of material supply constraints (Bauer et al., 2023; IEA, 2021, 2023a). Of primary concern are “critical raw materials” defined as materials with high technical and/or economic importance, as well as elevated probability of supply disruption (Dewulf et al., 2016; Schrijvers et al., 2020). Therefore, while the PV industry has historically focused on improving efficiency and reducing costs, the availability of key input materials has become an equally pressing issue to address to scale up PV capacity and ensure the industry’s long-term sustainability (Wang et al., 2023).
Silver is generally not considered as critical raw material (EU, 2023; USGS, 2022b). In the EU, for instance, this is because, while its economic importance is considered elevated, its supply risk is estimated to be low (EU, 2023). Despite this, the availability of silver has emerged as a potential constraint for the large-scale expansion of PV (Gervais et al., 2023; Hallam et al., 2023; Verlinden, 2020; Zhang et al., 2021). Silver is a relatively scarce element in the Earth’s crust, with global reserves estimated at around 530,000 tons (EU, 2022; USGS, 2022a). This material is fundamental for all crystalline silicon (c-Si) PV technologies, which currently account for 97 % of the PV market (VDMA, 2024). Appropriately, although its usage per cell is in the order of milligrams, silver plays a critical role in forming the metallization and conductive pathways necessary for generating and transmitting electric current (VDMA, 2024; Verlinden, 2020; Zhang et al., 2021). Additionally, silver is also a cost-critical resource (VDMA, 2024). In fact, silver is the second most expensive material in modern PV cells, only after polysilicon (VDMA, 2023). Despite making up just 0.14 % of a PV module’s weight, silver accounts for approximately 60 % of the cell cost and 10 % of the module cost (Fraunhofer ISE, 2022b; Gielen, 2021; Strachala et al., 2017). As a result, the price of PV technologies is sensitive to potential fluctuation in silver prices.
The crucial importance of silver in the PV industry is further exacerbated by the ongoing shift in the dominant PV technology. In fact, within the c-Si segment, it is expected that Passivated Emitter and Rear Contact (PERC) cells, which currently represent the industrial standard, as illustrated in Fig. 2, will be gradually replaced as dominating technology by more efficient c-Si sub-technologies, such as Tunnel Oxide Passivated Contact (TOPCon) cells and c-Si Silicon Heterojunction (SHJ) cells.
While offering higher efficiencies, these designs are also more silver intensive, given that unlike PERC cells - which use silver exclusively for front-side metallization - they require silver for both the front and rear side. Consequently, TOPCon and SHJ cells use respectively 1.5 and 2 times more silver per gigawatt compared to PERC cells. This technological shift is anticipated to drive an increase in the industry’s silver demand, which in 2023 accounted for around 19 % of global supply (The Silver Institute, 2024; VDMA, 2024). The dependency of the solar industry on silver is intensified also by the current lack of suitable substitute materials. Due to silver’s unmatched electrical conductivity and the maturity of silver screen-printing processes, alternative materials and metallization techniques still have to address challenges before getting competitive (Zhang et al., 2024).
Beyond photovoltaics, as a precious metal with its exceptional electrical and thermal conductivity, silver is particularly suitable for a wide range of high-value applications (EU, 2022). In 2023, 55 % of global silver demand came from industrial sectors, including PV, electronics, brazing alloys and solders and automotive (The Silver Institute, 2024). Non-industrial applications, such as jewelry and silverware, accounted for the remaining 45 % (The Silver Institute, 2024). As silver is virtually present in nearly all electronic devices, it expected to play a crucial role in the ongoing global digitalization. In the automotive sector, silver is essential for the shift toward electric mobility. While internal combustion engine vehicles typically contain 15–28 g of silver, hybrid and battery electric vehicles (EVs) use approximately 18–34 g and 25–50 g, respectively (The Silver Institute, 2021c). Additionally, silver is a key component of power grids and electrical networks, which must be expanded and modernized to support increasing levels of electrification across energy systems.
Given silver’s fundamental role in the expansion of solar energy, gaining a clear understanding of future demand along with its global supply chain is essential to assess the likelihood and potential scale of supply disruptions. As discussed above, key parameters in determining future silver demand are: 1) PV deployment based on required cumulative capacity; 2) Market shares of each c-Si sub-technology; 3) Specific silver intensity of each c-Si PV sub-technology; 4) Silver demand from competitive sectors.
Regarding the anticipated expansion of the solar industry, many earlier projections in the literature on cumulative capacity and future PV deployment appear rather conservative. For example, Elshaki & Graedel (2013) project 2 TW by 2050; Hund et al. (2020) estimate 2–8.5 TW by 2050; Månberger & Stenqvist (2018) foresee 7 TW by 2060; and Davidsson & Höök (2017) suggest 9 TW by 2050. In reality, global PV capacity already reached 2 TW in 2024. In light of the extremely rapid developments in the PV market in recent years, these projections seem to significantly underestimate the scale of the industry’s likely expansion over the next two decades. Therefore, more ambitious PV deployment scenarios, as the ones depicted in Fig. 1, appear more plausible and should be considered when in estimating material demands.
Similarly, the issue of conservative or non-materialized assumptions also applies to PV technology market shares and material intensity data. While many studies project growing shares of thin-film technologies (e.g., CdTe, CIGS, a-Si) (Davidsson and Höök, 2017; Elshaki and Graedel, 2013; Månberger and Stenqvist, 2018; Hund et al.; 2020), these technologies have in fact lost significant market share in recent years (Fraunhofer ISE, 2023). This decline is largely due to their generally lower efficiencies compared to c-Si, and the rapid cost reductions achieved by c-Si driven by economies of scale and continuous technological advancement (Carrara et al.; 2020; IEA, 2022). Moreover, most studies generally differentiate PV technologies considering c-Si, CdTe, CIGS, a-Si etc. (Carrara et al., 2023; Dong et al., 2025; Hund et al.; 2020; Liang et al.; 2023; Schlichenmaier et al., 2022). However, this broad categorization, fails to distinguish between c-Si sub-technologies such as PERC, TOPCon and SHJ, which have notably different material requirements, especially for silver (VDMA, 2024). Silver intensity values also vary significantly across sources, often relying on outdated data and failing to account for ongoing improvements in material efficiency, as noted by Goldschmidt et al. (2021).
As mentioned, only a few studies examining material demand in the PV industry differentiate between various c-Si sub-technologies, offering a valuable view on future silver requirements (Gervais et al., 2021; Hallam et al., 2023; Xu et al., 2024). However, due to the rapid development of the PV industry, there is a need for continuous and frequent recalibration of material demand projections in the sector. For instance, regarding silver intensities, Gervais et al., 2021 consider 18 t/GW and 42 t/GW of silver in PERC and SHJ, respectively, in the period 2020–2024. This values are approximately double of what reported by VDMA (2024), highlighting the rapid improvements in material efficiency achieved in recent years. Furthermore, as most studies focus exclusively on silver demand within the PV industry, the broader context of silver’s use across multiple domains is generally overlooked. The PV sector however accounted for 16 % of total silver demand in 2023 (The Silver Institute, 2024). External sectors play a critical role in shaping overall demand dynamics and represent an important factor to be considered when analysing potential supply constraints, as they largely influence both the timing and the scale at which such constraints might occur. Despite this, only a few studies encompass material demand from competing sectors in their analysis (Dong, et al., 2025; Schlichenmaier et al., 2022).
Finally, most studies compare projected demand either to known reserves or to current annual production volumes (Dong et al., 2025; Elshkaki and Graedel, 2013; Schlichenmaier et al., 2022). These methods offer a limited view, as reserves represent only those deposits that are economically viable under present market and technological conditions. Likewise, using current production volumes overlooks the potential for supply to expand in response to rising demand. The structure of the material supply chain is also rarely examined, even though such analysis is crucial to understanding whether supply can realistically scale to meet demand within the relevant time frame.
This research aims to address the identified gaps by providing a holistic silver demand projection-to-supply comparison for the 2023–2030 period, contributing to a more complete and accurate understanding of potential future silver market and offering insights into the likelihood of short-term silver supply risks. More in detail, this research aims to first update and enhance silver demand projections for the PV industry. This is done by incorporating recent PV deployment scenarios, distinguishing between c-Si sub-technologies (PERC, TOPCon, SHJ, IBC, and tandem), and using updated market share forecasts and silver intensity data, based on industry values (VDMA, 2024). Multiple scenarios are developed based on varying PV deployment rates and technological pathways, to investigate the impact that a shift toward more silver-intensive technologies and varying silver reduction trends might have on the overall silver demand in the sector. Subsequently, the research adopts a cross-sectoral approach to provide a broader perspective on future silver demand, extending the analysis beyond the PV industry to include competing sectors. Finally, the research aims to provide a holistic demand-to-supply comparison by 2030, forecasting silver supply and analysing supply chain dynamics. This approach complements traditional comparison with reserves and helps identify key factors in the supply chain that could either constrain or enable rapid supply expansion. By doing so, it offers valuable insight into the likelihood and potential scale of silver supply risks by 2030.
Therefore, the main contributions of this research lie in improving the accuracy of silver demand projections for the PV industry and in integrating the all the aforementioned elements into a unique assessment. To our knowledge, no prior research has combined all the outlined parameters to offer a perspective on silver demand and supply through 2030.
a
Research Group Sustainable Systems Engineering, Department of Green Chemistry & Technology, Ghent University, Coupure Links 653, Ghent 9000, Belgium
b
ENGIE Laborelec, Rodestraat 125, Linkebeek 1630, Belgium
c
ENGIE Research, 1 Pl. Samuel de Champlain, Paris‑La Défense 92930, Paris, France
d
Department of Electromechanical, System and Metal Engineering, Ghent University, Technologiepark Zwijnaarde 131, Zwijnaarde, Belgium