Founders Preview: Fear, Greed, Options and Vixx
How to measure greed and fear
One of the best available and accepted tools to measure stock market volatility is CBOE Volatility Index, elaborated by Chicago Board Options Exchange in 1993.[11] In other words, VIX can be defined as a sentiment ratio of Wall Street's fear or greed gauge. It is usually used by traders to check the grade of investor complacency or market fear.[12]
In practice, VIX is usually called the fear index. In case of increased VIX index, investors' sentiment leans toward higher volatility which corresponds to higher risk.[13] If a VIX reading is under 20 it usually indicates that investors became less concerned;[11] however, if the reading exceeds 30 it implies that investors are more fearful because prices of the options increased and investors are more prone to pay more to preserve their assets.
- Wikipedia
Fear and Greed in stocks is indicative of dominance.
WORK SHEET: IDENTIFYING FEAR and GREED LEVELS
Stocks
Metals:
Energy
What is volatility
implied
Realized/ historical
1987 crash:
indexing, portfolio insurance, the crowded trade of ‘martingale-method’
Hedging long stock risk post 1987
Buy insurance
Create dividends, lower cost basis
Collars are invented
The effect on Option markets-
Calls sold, Puts bought
Stock Market “tell” is born
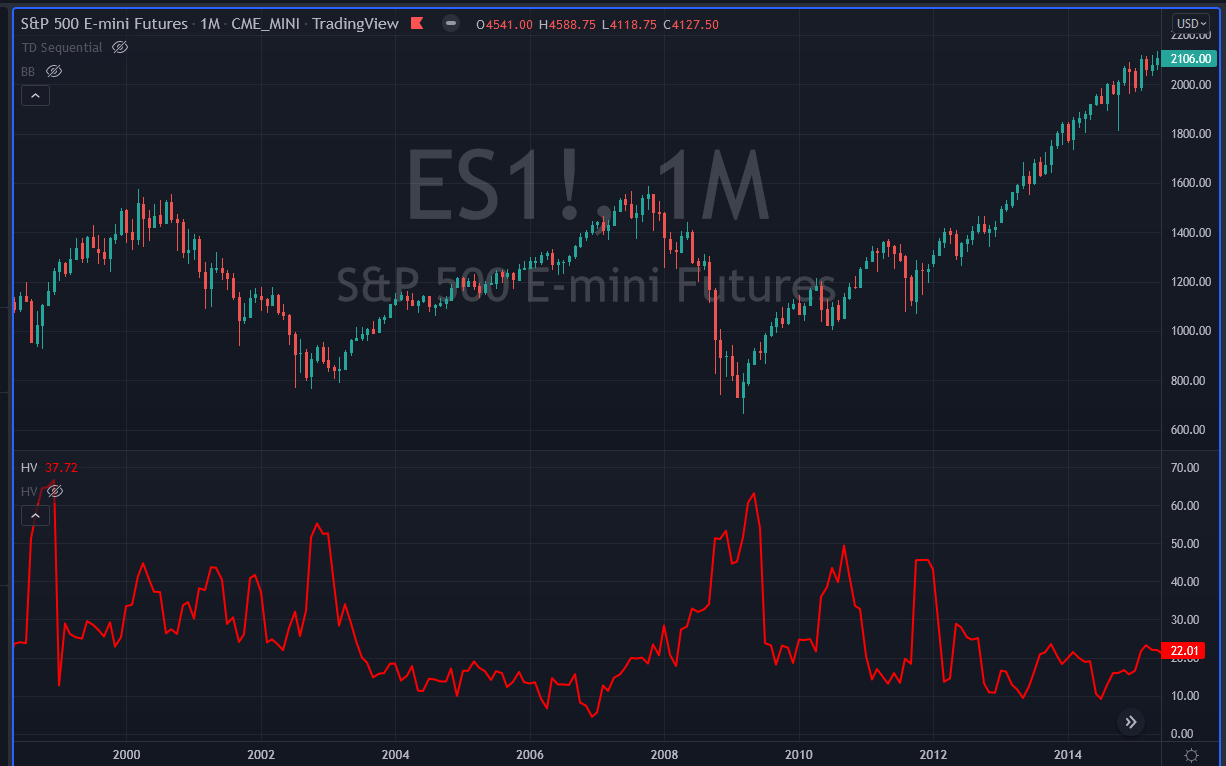
Why Vol expands in a dropping market and drops in a rally
Who is long stocks, who is short stocks
Stochastic volatility- who is most likely to panic first
The Vixx created 1993: The rise of Volatility as a reliable predictive indicator
2004- Vixx Futures listed : the arbitrage begins
Introduced in 2004 on Cboe Futures Exchange℠ (CFE®), VIX futures provide market participants with the ability to trade a liquid volatility product based on the VIX Index methodology.
GFC and 2009: death of predictability:
In January 2009, S&P Dow Jones Indices launched the S&P 500 VIX Futures Index Series
the Fed (PPT) sells volatility,
the tail wags the dog.
Rise of Vixx by TV Popularity
Misuse by TV
the rise of over bt/oversold contrarian use
Implied vs Realized as indicator
The rise of skew as modifier
What you can absolutely know by Vol/skew indicators
Risk/reward
dominant player types- buyers and sellers
advanced use- stochastic vol plays
The world since 2009- stock buybacks, short squeezes, and dark pools
Gold options pre GLD and post GLD as example
who dominated
Why did they dominate
Skew as tell
VBS
Option modeling example graphs
Notional Area
Smile
“law” of conservation of volatility: Vol, skew, kurtosis knobs
skew in notional
skew in smile
ATM vol predictability given a move in mkt
Fat tails: Kurtosis-
Option Work sheet
Old man story:
Options Education: Lehman brothers executives and Rule 144, client buys calls, getting hired at CNA, Roy Neff at christmas party, PDE model guinea pig, life experience, Pit Trader, CSO modelling, from commodities to equities to commodities, AMEX- Timber hill/ CRT, Susquehanna. Gold, and manipulation


