Labor Supply of Newly Immigrated Workers
Since the end of the pandemic, monthly payroll employment growth has been surprisingly high, with 205,000 jobs added per month on average in 2023, which the Bureau of Labor Statistics notes here. Meanwhile, earlier this year, the Congressional Budget Office (CBO) raised its projection of net immigration for last year and this year from 2.6 million to 6.6 million. Recent studies have shown that the increases in net immigration led to significant increases in the breakeven employment growth—the monthly payroll growth needed to maintain an unemployment rate consistent with "full employment"—thus implying that the labor market was less tight than suggested by the monthly payroll employment growth. These studies primarily focus on the extensive margin, examining the impact of the number of immigrants entering the US labor market. This blog post, however, investigates the intensive margin: the labor supply behavior of an average immigrant worker in the first few years of arriving in the United States. (You can also read more on this subject here, here, and here.)
Using data from the US Census Bureau's American Community Survey (ACS), we can see that immigrants work less intensively than native workers immediately following their arrival. They exhibit lower labor force participation rates, employment rates, number of weeks worked per year, average weekly hours, and total hours worked per year. However, as they continue to reside in the United States, their work intensity approaches that of native workers. By their fifth year of immigration, these labor market indicators are similar to those of native-born workers.
Labor supply of immigrants
The ACS is a geographically representative survey of approximately 3.5 million addresses in the United States. The survey strives to capture information on a respondent's immigration status, especially the year a given respondent moved to the United States from abroad. For our analysis, we focus on the respondents aged 16 to 65 between 2010 and 2022. In addition, we focus on immigrants without a college degree since, according to the CBO, most of the increase in the projections for net immigration came from undocumented immigrants. However, the patterns observed here remain consistent for the entire set of immigrants or immigrants of Hispanic origin.
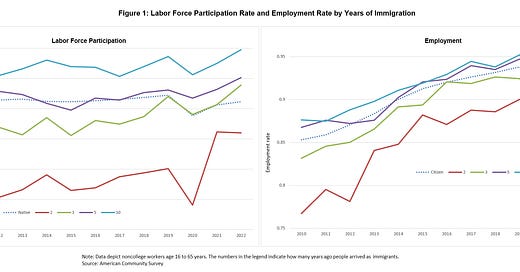
Figure 1 examines the labor force participation rate and the employment rate by years of immigration and compares these rates with those of native-born workers. Figure 2 is similar to figure 1 but focuses on hours worked annually. Figure 3 decomposes annual working hours into weeks worked per year and hours worked per week. In the figures, immigrants are grouped by the years they have been in the United States. We consider the second-year, third-year, fifth-year, and tenth-year immigrants. (We omit the first-year immigrants to avoid distortions from respondents who might have immigrated less than a year before being surveyed.)
Figures 1–3 exhibit a similar pattern by years of immigration. Newly immigrated workers exhibit significantly lower labor force participation rates, employment rates, annual working hours, weeks worked per year, and weekly hours. These indicators increase gradually with the number of years that immigrants have been in the country. By the fifth year, all these labor market variables for immigrants are at similar levels to those of native workers.
These patterns still hold when focusing on prime-age workers (age 25–54) or older workers (age 55–65). For younger workers (age 16–24), the patterns hold for the labor force participation rate but less so for other indicators. At the time of arrival, many immigrants work in agriculture. One might argue that this could be the reason for the low number of weeks worked per year by brand-new immigrants, since agricultural work is highly seasonal. However, we find that excluding agricultural workers does not significantly affect the patterns shown in the figures.
The documented patterns by years of immigration have important implications for the labor market. First, they imply that ignoring the distinct labor-supply behavior between newly immigrated workers and natives overstates the true impact on the labor market of the recent increase in immigration flow. Second, going forward, they imply that the large inflows of immigrants since the pandemic will continue to weaken the labor market in the next few years as these immigrants will likely increase their labor supply gradually after arriving. Whether these patterns persist, and what their impact on the labor force might be, are questions that bear watching—which we will certainly do.
the Congressional Budget Office (CBO) raised its projection of net immigration for last year and this year from 2.6 million to 6.6 million.
Raised its projection of illegal aliens that entered the country last year to 6.6 million.
Had to fix the Atanta Feds miswording.