Weekly: Gold looks Good. Beware The War Double Whammy
Goldman on Recession, JPMorgan's Blackbook
Housekeeping: Many will be receiving GoldFix Weekly for the first time. It is different than the dailies. This post is more like a magazine. Content touches many areas of markets. The index may help.
Founder’s Class : preview link here
SECTIONS
Market Summary
Technicals
Podcasts
Calendar
Charts
Premium divider
Analysis
Research
1. Market Summary
GoldFix Last Sunday- Could it be that stocks finally bottomed Thursday?
Mon. to Tues. afterwards- Yes they can!
Wed. to Fri.- Not on your life kiddo.
Friday in the nutshell. Friday morning futures started falling at 0500ET, accelerated lower at the open around 0930ET, bottomed for the day at 1330ET, then in the last 30 minutes of the day, ramped it all back.
Every day last week was a variation of that, with the ramping back part being less effective to varying degrees. On the week, Nasdaq was the biggest loser, down almost 5%.
Bonds Rise Again
Stocks decoupled from Bonds again form Wednesday onward, meaning weaker stocks is a buy indicator for Bonds as a flight to relative safety returns. This started Wednesday last week. Here’s how that can play out from experience and a lifetime of listening to pundits spinning bull narratives.
The Good Version: Bonds are being bought in a stock selloff as opposed to just cash again. That means rates are high enough to attract investment again. Therefore the bottom for stocks may soon be at hand.-Not wrong.
The Bad Version: Fed is doing QT now, which means it will be selling bonds as it raises rates. What we saw last week was a pause in a much bigger picture selloff in both assets. - Also not wrong.
Choose your reality carefully. Both can be true
The S&P is now in a bear market, along with Small Caps and Nasdaq, which is suffering its biggest drawdown since the great financial crisis. For the last 8 weeks, following the late-March meltup, The Dow is down 13% and Nasdaq -25%.
The Fear/ Greed Indicator And Capitulation
The VIX rose on the week, but not nearly what one would think it could. It is important to understand that this is a broken indicator.
If volatility doesn’t rise in a market selloff that can and frequently is an indication of investors already being smartly hedged. Which implies if we continue to go down, we are not going to dump yet, but could go down slowly for some time. We call this Potted Frog Vol.
The flip side is soft volatility in a drop can signify a rally is coming. But that is during QE with increasing money supply. We are in QT with a decreasing float.
On the week, Nasdaq was the biggest loser, down almost 5%.
So, if the Vix stinks for managing expectations, what to use? We like very much this chart by Zerohedge when looking for some clue as to what the market could get to before stabilizing somewhat
It implies we have a little more to go. Keep in mind, even if it is right, we expect a 5% overshoot before going back up to the level implied by the Rate hike expectations. Volatility is their mandate so to speak and capitulation typically comes when the most important stocks scream lower. They still haven’t done that yet.
H/t Newsquawk and Zerohedge for data and some graphics
Sectors:
FANG stocks have fallen for 8 straight weeks
Monkeypoxx vaccine makers did well we guess
Energy did well
Utilities also did ok
Gold stocks did well also… hmmmm
Here are the biggest loser from their post-COVID highs...
Source: Bloomberg
Commodities:
Gold had a solid week amid the weaker dollar closing in on $1850 again
The dollar suffered its first weekly drop in 8 weeks
WTI closing back above $110
Record high in Gasoline prices again
TME on Gold: Watch the Yuan
Excerpt: The dollar matters for the shiny metal. Goldman Sachs reminds us: "Since the vast bulk of gold is produced and consumed outside of the US, broad-based dollar appreciation should lead to a similar depreciation in gold, all things equal.
The dollar has been strong, but did you know that the DXY has done nothing since April 28? Imagine if the DXY rolls over and starts trading below the steep trend line. There is another currency that gold has followed closely over the past weeks. The Chinese Yuan. Watch this one closely as well for potential inputs for gold.
Their report goes on to suggest a call spread for bull speculators which is worth discussing Sunday. These guys have good analysis that can be quickly digested.. TME.com
We would add that this is further evidence of a raised floor in Gold. We would caution that if peace breaks out, the following will likely happen creating a double whammy for Gold:
Gold can drop along with the dollar.
Stocks will probably scream higher
Then, the Fed raises rates aggressively in a surprise hike to get stocks under control.
What does Gold do then?
Nobody bullish on Gold is talking about this. They should be
Keep some (not all) powder dry to buy that dip if it comes- VBL
Bonds:
Treasuries were notably bid this week, led by the longer-end
The curve flattened significantly
10Y yields touched 3.00% and then puked back lower, to their lowest close in a month
Crypto:
Bitcoin ended the week lower from last Friday's "close" but has traded in a relatively narrow range since then (albeit trading at the lows of that range now, back below $30k).
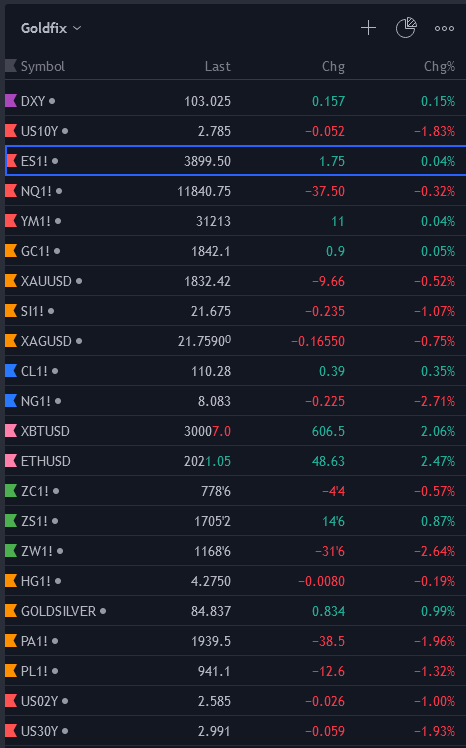
GoldFix Friday WatchList:
Complete Watchlist Here
2. Technical Analysis
Report Excerpts Courtesy MoorAnalytics.com
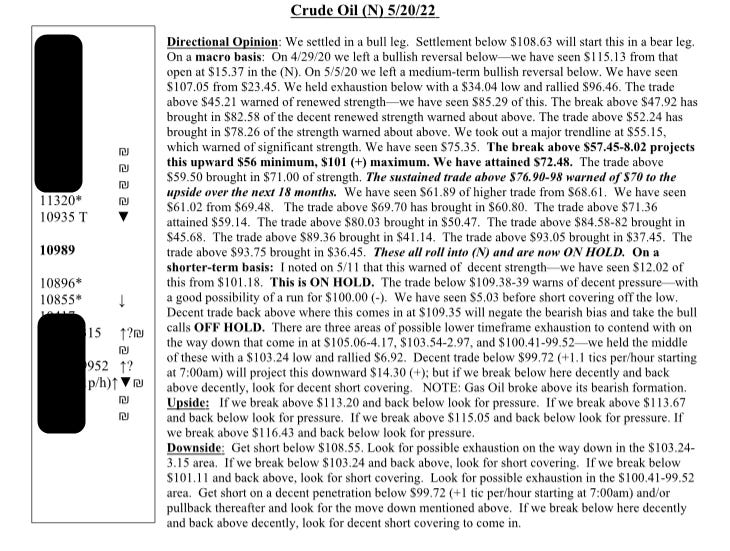
GoldFix Note: Do not attempt to use price levels without symbol explanations or context. Moor sends 2 reports daily on each commodity they cover. The attached are non-actionable summaries.
Gold
TECHNICALLY BASED MARKET ANALYSIS AND ACTIONABLE TRADING SUGGESTIONS Moor Analytics produces technically based market analysis and actionable trading suggestions. These are sent to clients twice daily, pre-open and post close, and range from intra-day to multi-week trading suggestions. www.mooranalytics.com
Energy
Bitcoin
Go to MoorAnalytics.com for 2 weeks Gold, Oil, and Bitcoin reports free
3. GoldFix and Bitcoin Podcasts

More GoldFix Broadcasts HERE
More Bitcoin Podcasts HERE
4. Calendar
Some upcoming key data releases and market events
MONDAY, MAY 23 None scheduled
TUESDAY, MAY 24
9:45 am S&P Global U.S. manufacturing PMI (flash) May 58.0 59.2
9:45 am S&P Global U.S. services PMI (flash) May 55.4 55.6
10 am New home sales (SAAR) April 750,000 763,000
WEDNESDAY, MAY 25
8:30 am Durable goods orders April 0.6% 0.8%
8:30 am Core capital equipment orders April -- 0.9%
2 pm FOMC minutes
THURSDAY, MAY 26
8:30 am Initial jobless claims May 21 222,000 218,000
8:30 am Continuing jobless claims May 14 -- 1.32 million
8:30 am Real gross domestic product revision (SAAR) Q1 -1.3% -1.4%
8:30 am Real final sales to domestic purchasers revision (SAAR) Q1 -- 2.6%
8:30 am Real gross domestic income (SAAR) Q1 -- 5.1%
10 am Pending home sales index April -1.7% -1.2%
FRIDAY, MAY 27
8:30 am PCE inflation April -- 0.9%
8:30 am Core PCE inflation April 0.3% 0.3%
8:30 am PCE inflation (year-over-year) April -- 6.6%
8:30 am Core PCE inflation April 4.9% 5.2%
8:30 am Real disposable income April -- -0.4%
8:30 am Real consumer spending April -- 0.2%
8:30 am Nominal personal income April 0.5% 0.5%
8:30 am Nominal consumer spending April 0.6% 1.1%
8:30 am Advance trade in goods April -- -$125.3 billion
10 am UMich consumer sentiment index (final) May 59.1 59.1
10 am 5-year inflation expectations (final) May -- 3.0%
Main Source: MarketWatch
5. Charts
Gold
Silver
Dollar
Oil
RUBLE: Waning effectiveness of sanctions
Charts by GoldFix using TradingView.com
6. Analysis:
Excerpted Portion for Zerohedge readers
7. Research
Goldman Gives us a 35% chance of recession
A recession is not inevitable, but clients constantly ask what to expect from equities in the event of a recession. Our economists estimate a 35% probability that the US economy will enter a recession during the next two years and believe the yield curve is pricing a similar likelihood of a contraction.
Rotations within the US equity market indicate that investors are pricing elevated odds of a downturn compared with the strength of recent economic data.
PSA: We say its a 90% chance and explained the reasoning here on April 4th. Banks are just not allowed to declare a recession until after the fact. Their business is stock sales. So while they may give their clients good advice in a recession. They cannot call it what it is.
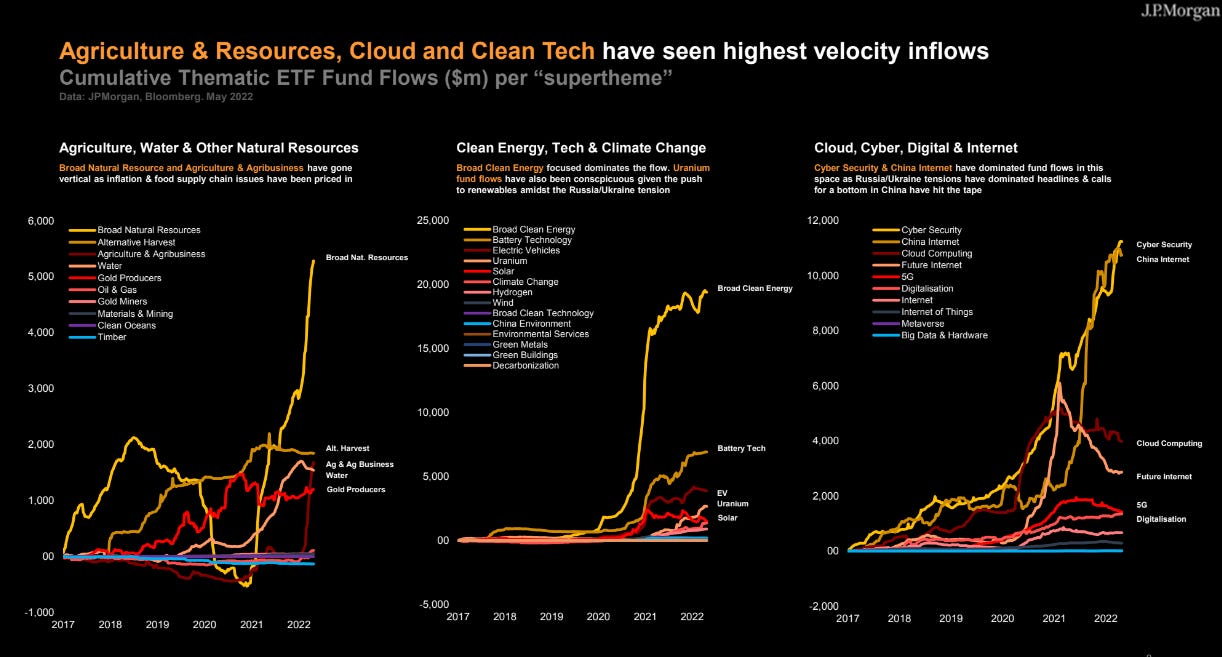
JPMorgan’s Annual Thematic Blackbook
for institutional investors is a 173 page book of ideas based on global themes. It identifies themes that are and will continue to attract money, and of course suggests how to participate in them. If nothing else: it will get your mind thinking about the future, and it is not hard on the eyes.
Sample slides:
***More at bottom***
Zen Moment
Careful what you wish for:


