


Weekly: Japan's Largest Bank Sees $2300 Gold by Year End, Goldman Spies Recession
Why Yield Curve Inversion Matters and The Fed Knows it

Housekeeping: We picked up a bunch of new subscribers this week and want to welcome them. Many will be receiving GoldFix Weekly for the first time. It is different than the dailies. This post is more like a magazine. The content touches many areas of markets. Use the index if you like.
Founder’s Class : 3 p.m. SUNDAY: Preview and zoom Link here:
SECTIONS
Market Summary
Technicals
Podcasts
Calendar
Charts
Premium divider
Analysis
Research
1. Market Summary
Stocks were mixed, Bonds gyrated front to back, and Commodities were lower on the week. Why did stocks sink this week? No-one knows. One “crazy” idea could be that rising short term rates (above long term rates) make the opportunity cost of owning stocks too high. Or as some might say: the inverted yield curve did it!
Nasdaq and Small Caps positive on the week
The Dow and S&P laggards
Relative Strength of Nasdaq compared to Dow and SPX on display early in the week…

All Major US equity markets lost key technical levels. S&P back below its 100-DMA, Dow broke back down through its 100- and 200-DMA, Nasdaq failed at its 100-DMA, as did Russell 2000.
Equities, along with Crypto and absent real ( Recession/War) news, are ever so slightly starting to net drift towards risk on again via the rotations into Nasdaq - crazy but there it is. Data and some graphics via Zerohedge’s Friday recap post
Sectors:
Financials were the hardest hit sector
Utilities outperformed

Transports had the worst week since Jan 2021
Trucking stocks stood out this week from the first job losses
Commodities: Mitsubishi Likes Gold Alot
Commodities traded broadly lower this week
Gold held nicely above $1900 but was lower on the week
GOLD:
Gold prices have come under continued pressure on elusive ceasefire talks, lower oil and higher yields. Safe-haven demand has steadily exited the bullion market, but geopolitical risks were by no means totally calmed. Russia insisted that Europe pay for gas in RUB, which Europe has said it won't do, leaving some questions over future gas supplies (see natural gas section above). We continue to believe the current environment presents a good entry point to buy gold as a currency of last resort against growing risks to the global economy.
Year-to-date, gold has lagged the commodity rally, rising only 5% against 24% for the broader index, primarily due to concerns over Central Bank of Russia (CBR) sales and risk to crypto overtaking the traditional role of gold due to its inherent efficiency in avoiding government restrictions.
Such concerns are misplaced in our view and cloud the market focus from rising risks surrounding the growth-inflation mix in developed markets, which is the, by and large, the most important driver of gold. We believe that gold prices will now accelerate from current levels, ending the year north of USD2,300/oz.
Full report at bottom…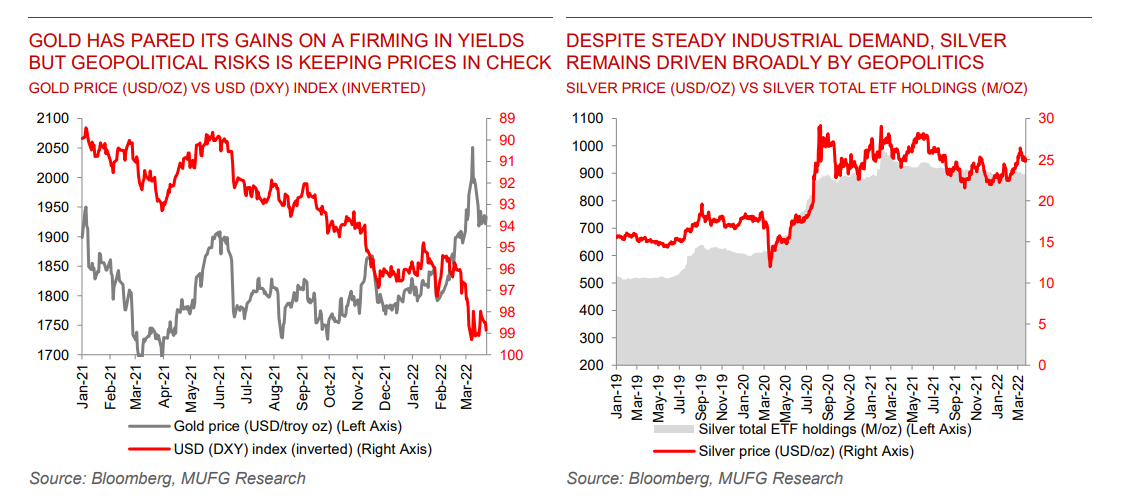
SILVER:
Silver has slightly outperformed gold year-to-date, up 7% versus gold’s 5% gain as investors have positioned for inflation and strong industrial demand despite supply chain challenges.
Similar to gold, silver has seen a pick-up in CFTC positioning, although ETF inflows have been more modest given already elevated holdings. Silver should benefit on a medium term view from energy transition related demand, particularly for its use in solar.
However, given the broader risks to global growth with a backdrop of rising rates, the near term outlook may be more challenged.
Full report at bottom…WTI dropped back below $100 after Biden's SPR news being the final straw after the China lockdowns all but ensure an oil glut coming
Oil is, however, is still above where it was pre-Ukraine invasion. But the Ruble is now stronger than it was back then.
This was the worst week for commodities since March 2020
Bonds:
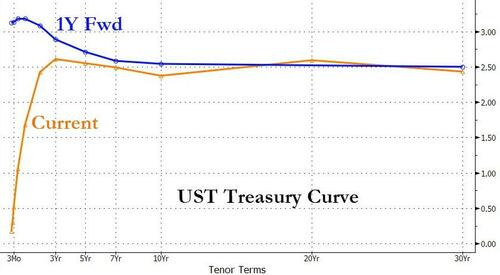
Massive divergence in bond markets this week as the short-end yields rose significantly while long-end rates dropped. The result was short term rates up and long term rates down again
everything from 2Year maturity on out is now inverted ( 1 year forward curve)
the shortest rates aren’t inverted over the 2 year which signals the Fed taking its time. That could change in a heartbeat with a surprise hike of 50bps or more
The market is now pricing in 9 more rate-hikes this year... and then almost 4 rate-cuts

Courtesy Zerohedge
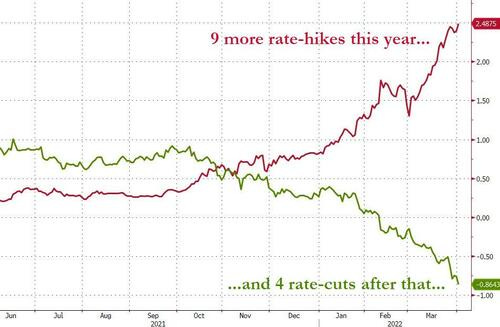
All this implies the Fed will hike rates to stop inflation. This will risk a major recession. Finally the market is then beginning to discount that once the Fed is done tightening, they will have to ease aggressively the other way immediately
Crypto:
Crypto rallied again. Global perception of a “risk-on inflation trade” might be growing. If you think the Fed will ease rates right after they raise them… you buy things with a limited supply that are liquid. Especially in light of the much weaker Yen.. Which itself may predict a Yuan debasement soon. We would not be surprised if people are shorting Yen and buying Bitcoin with the proceeds now in a new ( risky) carry trade.
GoldFix Friday WatchList:

Complete Watchlist Here
2. Technical Analysis
Report Excerpts Courtesy MoorAnalytics.com
GoldFix Note: Do not attempt to use price levels without symbol explanations or context. Moor sends 2 reports daily on each commodity they cover. The attached are non-actionable summaries.
Gold


TECHNICALLY BASED MARKET ANALYSIS AND ACTIONABLE TRADING SUGGESTIONS Moor Analytics produces technically based market analysis and actionable trading suggestions. These are sent to clients twice daily, pre-open and post close, and range from intra-day to multi-week trading suggestions. www.mooranalytics.com
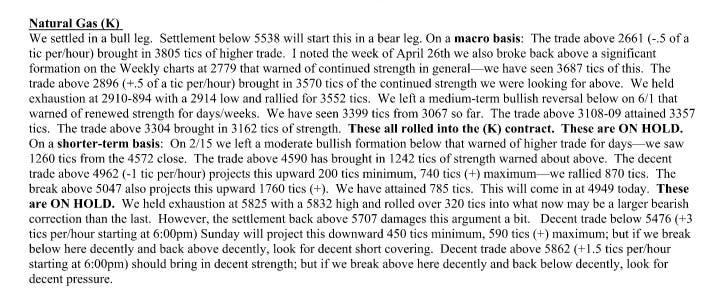
Energy

Bitcoin
Go to MoorAnalytics.com for 2 weeks Gold, Oil, and Bitcoin reports free
3. GoldFix and Bitcoin Podcasts
GoldFix Broadcasts HERE
Bitcoin Podcasts HERE
4. Calendar
Some upcoming key data releases and market events.
MONDAY, APRIL 4
10 am Factory orders Feb. -0.6% 1.4%
10 am Core capital equipment orders Feb. -- -0.3%
TUESDAY, APRIL 5
8:30 am Foreign trade deficit Feb. -$88.2 billion -$89.7 billion
9:45 am S&P Global (Markit) services PMI (final) March 58.9 58.9
10 am ISM services index March 58.0% 56.5%
WEDNESDAY, APRIL 6
2 pm FOMC minutes
THURSDAY, APRIL 7
8:30 am Initial jobless claims April 2 200,000 202,000
8:30 am Continuing jobless claims March 26 -- 1.31 million
3 pm Consumer credit Feb. $15 billion $7 billion
FRIDAY, APRIL 8
10 am Wholesale inventories (revision) Feb. 2.1% 2.1%
Main Source: MarketWatch
5. Charts
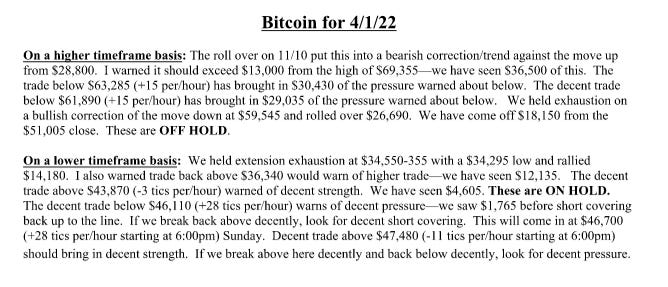
Dollar Index
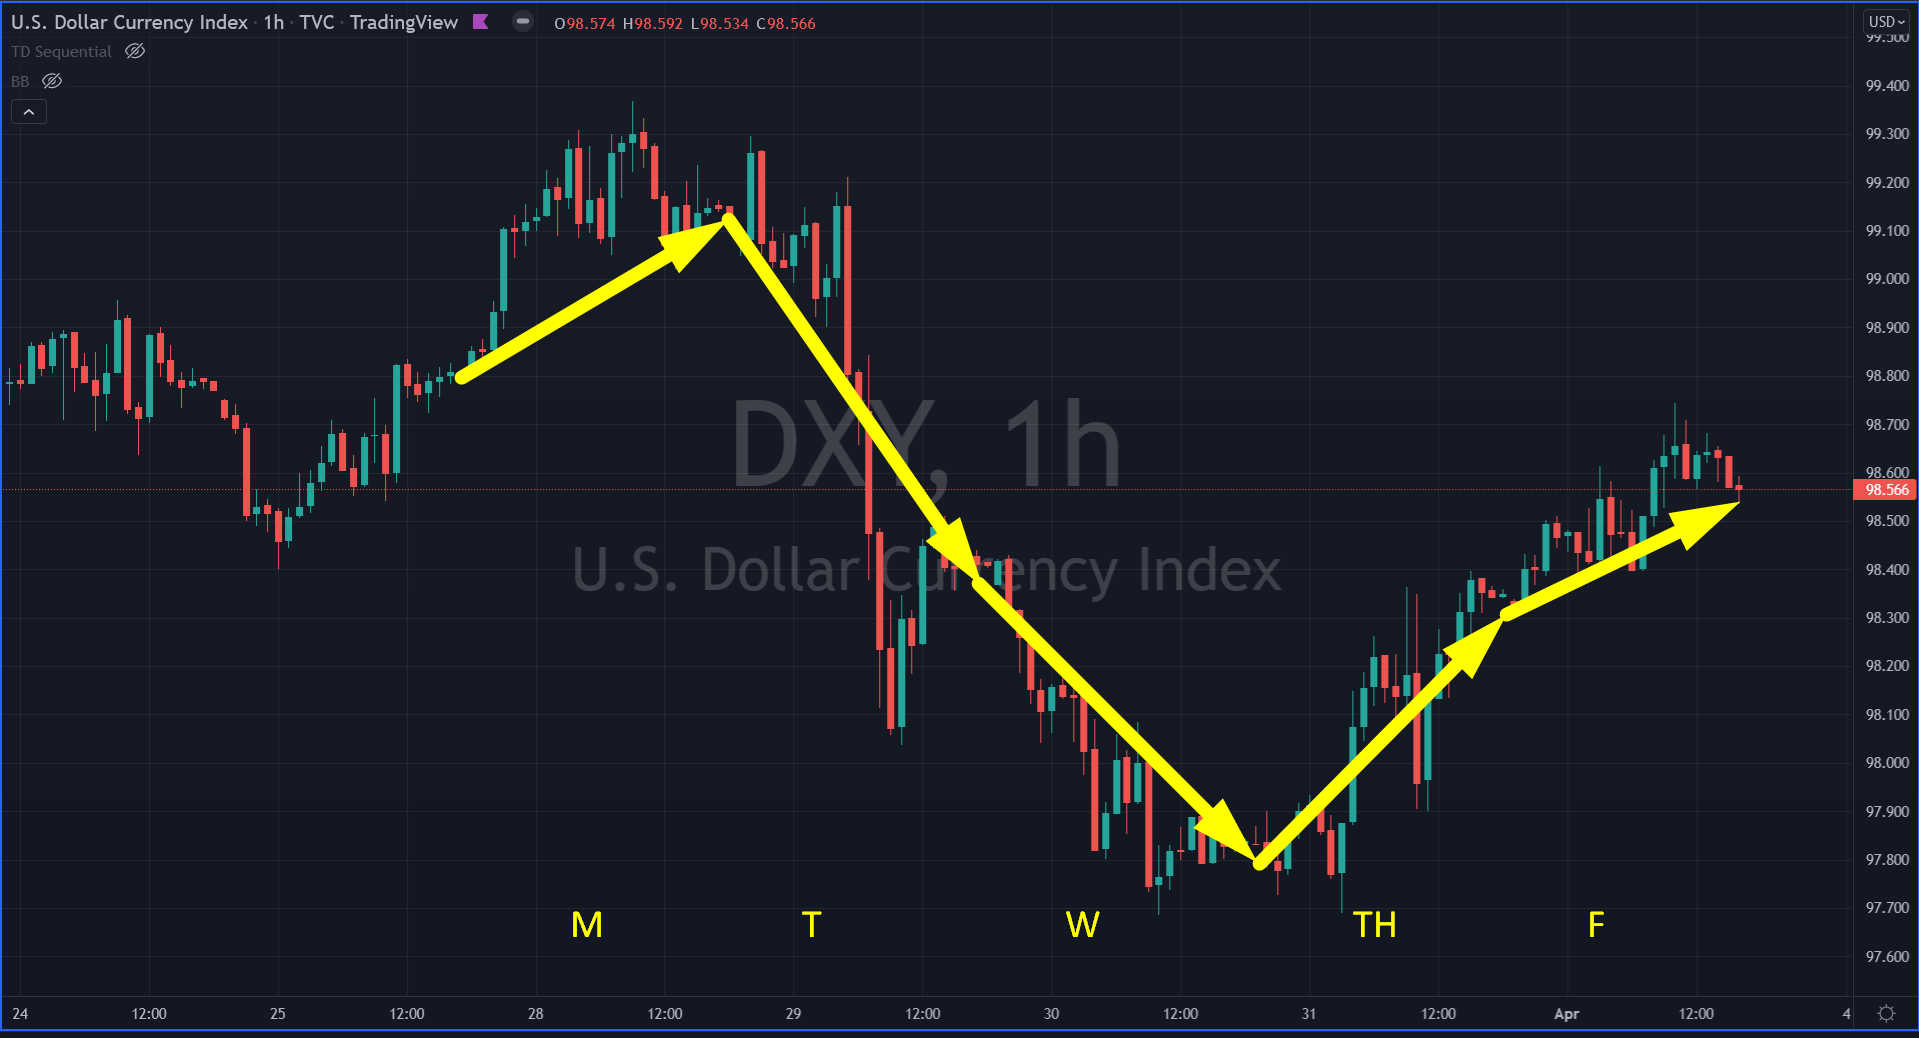
Gold
Silver

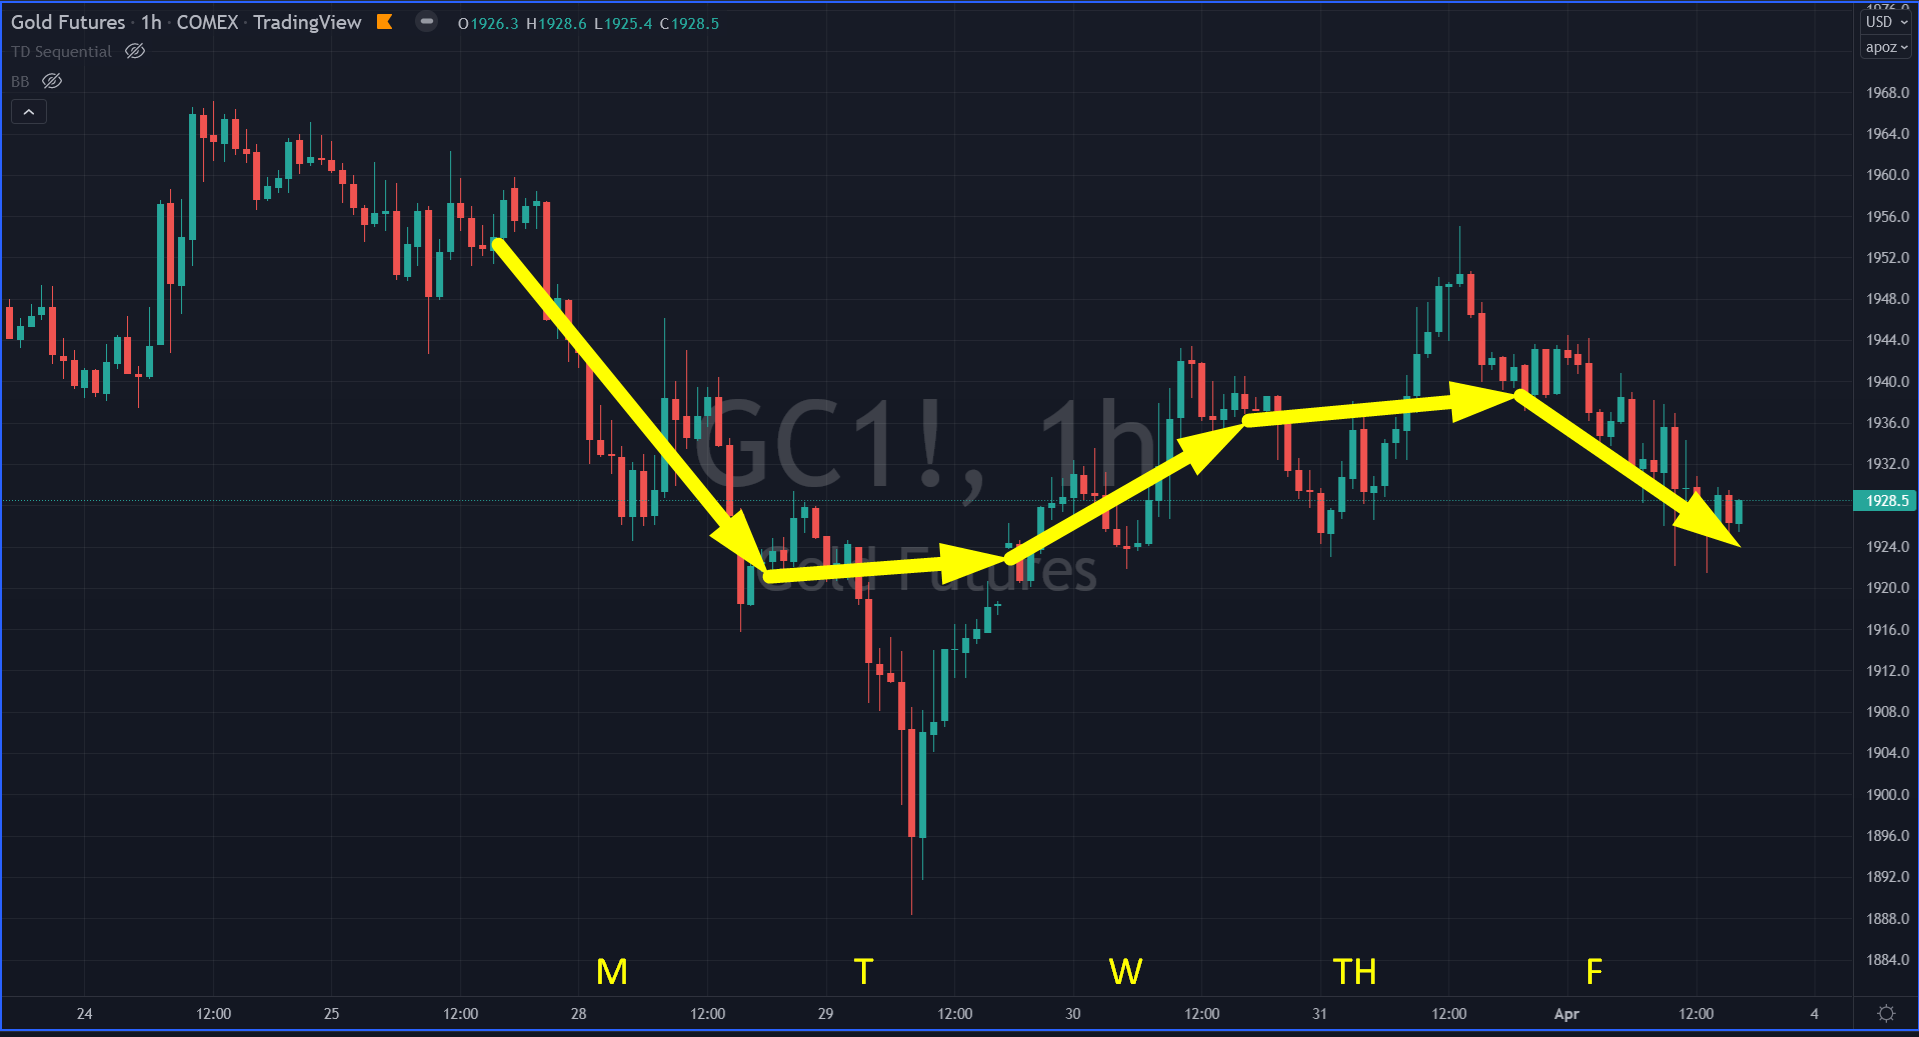
Oil
Charts by GoldFix using TradingView.com
6. Premium Excerpt: Inverted Yield Curves, The Fed, and Recessions
If history is any guide, the global economy could be sleep walking into a recession.- Mitsubishi Financial Group (MUFG)
We are currently in the teeth of four powerful forces chewing up the current economic outlook. Soaring inflation from commodities, rising interest rates, high ongoing geopolitical risks, and an inverted yield curve are all “conspiring” to undermine the global post-pandemic recovery.

These factors rarely coincide, but are not entirely unprecedented in recent history. Since the 1970s began, there have only been four prior times when these hit almost simultaneously according to a report by MUFG. And each time they ended in recession:
On only four occasions since the 1970s have soaring commodity prices, rising interest rates, an inverted yield curve and geopolitical risks simultaneously blended together. In each of these occasions the global economy witnessed a recession within the subsequent 11 months, on average.
Graphic: HISTORICAL EPISODES OF HIGHER COMMODITIES, HIGHER RATES, INVERTED YIELDS AND GEOPOLITICS
Graphic: YIELD CURVE INVERSION AND RECESSION FOR 75 YEARS
Inverted yield curves do not in and of themselves cause recession. They are the result, not a potential hysterical cause1. Rather, we say the yield curve is the recession already being partly baked in. And that is truly better than the wage-price spiral alternative.
Full report at bottom…7. Research
Mitsubishi on Oil, Gold, Silver etc
Goldman On Global Markets
Full report at bottom…Zen Moment:
