Housekeeping: GS positioning for 3% inflation target; BOA's Hartnett "De-Rates" Tech, and BBG charts Gold/Oil. Plus GF on the bullish landscape in metals. Moor gives the Tech levels. Off desk Mon/Tues. Cheers!
SECTIONS
Market Summary— Whole Lotta Buying
Research— GF, GS, JPM, BOA, and BBG
Week’s Analysis/Podcasts— Zoltan, CPI, and Gold
Charts— Metals, Forex, Energy, more
Calendar— PPI, Retail Sales, Housing (on radar for Pivot now)
Technicals— **GC**, SPX, BTC, CL, NG
Zen Moment— Magical Car
Full Analysis— Gold & Silver Drivers and more
1. Market Summary
This week many bullish macro factors drove markets. Cooling inflation, easing COVID lockdowns in China (maybe), and chatter around Russia-Ukraine 'peace' hopes all conspired to take stocks and Gold significantly higher.
Stocks ignored the FTX Crypto debacle and only focused on things related to potential for the Fed to back off its aggressive stance. And they were not disappointed. Even the Fed speakers were less hawkish.
FED HAWKS BACK OFF
Boston Fed President Susan Collins said the central bank has more work to tame inflation, but also the risk of going too far is now on their radar.
“I think that as we have raised rates that the risk of over tightening has increased,” Collins said Thursday during an interview with Bloomberg. She added: "I do think we’re going to need to raise rates further."
Collins said a smaller, more “deliberate” rate increase should not be confused for a sign the Fed is backing down from the task of curbing price pressures.
Side Bar: Anti-Goldilocks Saw This Coming
From our vantage point, parts of the economy will lag in response to hikes like real estate, and also take forever to work through the system. Meanwhile parts of the economy will lead, like layoffs. Combined, the risk of compounded stagflationary cycles increase.
This makes for an environment where unemployment is rising while real estate is crashing. It is all part of our anti-Goldilocks concept. No joke. Big secular changes are more important than what any one Fed person thinks they can do to stop them. Those 1990’s Goldilocks economy heros? They were lucky and thought they were good.
So the message seems to be uniform — more to come but slowing pace and over-tightening risk is a thing (the exact opposite of what Powell said during the press conference two days prior).
BUYING PUTS ISN’T BEARISH SOMETIMES
Meanwhile Goldman's trading desk pointed out that institutional put option hedging just hit a record high. This may seem bearish, and ultimately it can be. But when investment funds buy puts in a rallying market in Q4, it frequently means they are not going to sell for year end, but are making sure their portfolios are protected against any year-end mechanical selling or worse
It is insurance for a person saying: “I’m not going to give it back this time”. And that means put buying does NOT contradict what ZH has been saying about CTA buying going into year end.
In fact so close to year end put buying means only 1 of 2 things: Either they are likely not selling stocks (as described above), or they will get greedy and sell those puts in the next leg higher as ZH and Spot gamma infer. Which will spur more stock buying by marketmakers hedging out deltas
Anyway… all that sent stocks soaring to their best week since Nov 6th 2020, led by a 9% explosion in the Nasdaq.
Sectors/ Technicals
The S&P hit 4,000 Friday, breaking above the 50- and 100-DMAs on the week (200DMA is at 4080)
On the week, tech (longest duration stocks) were the biggest gainers (up over 10%) while Utes lagged (up only 1.4%)
Seasonality is definitely in stocks’ favor now. Call it “buy season” for stocks as well as commodities, though we don’t claim stocks have to go up, just that there is buying around, which if nothing else happens, will push stocks up.
The last two days have also seen the biggest short-squeeze on record, based on Goldman's "Most Shorted" basket. The 19% surge from Wednesday's close is bigger than March 2020's rebound surge and Jan 2021's meltup to the highs.
Commodities:
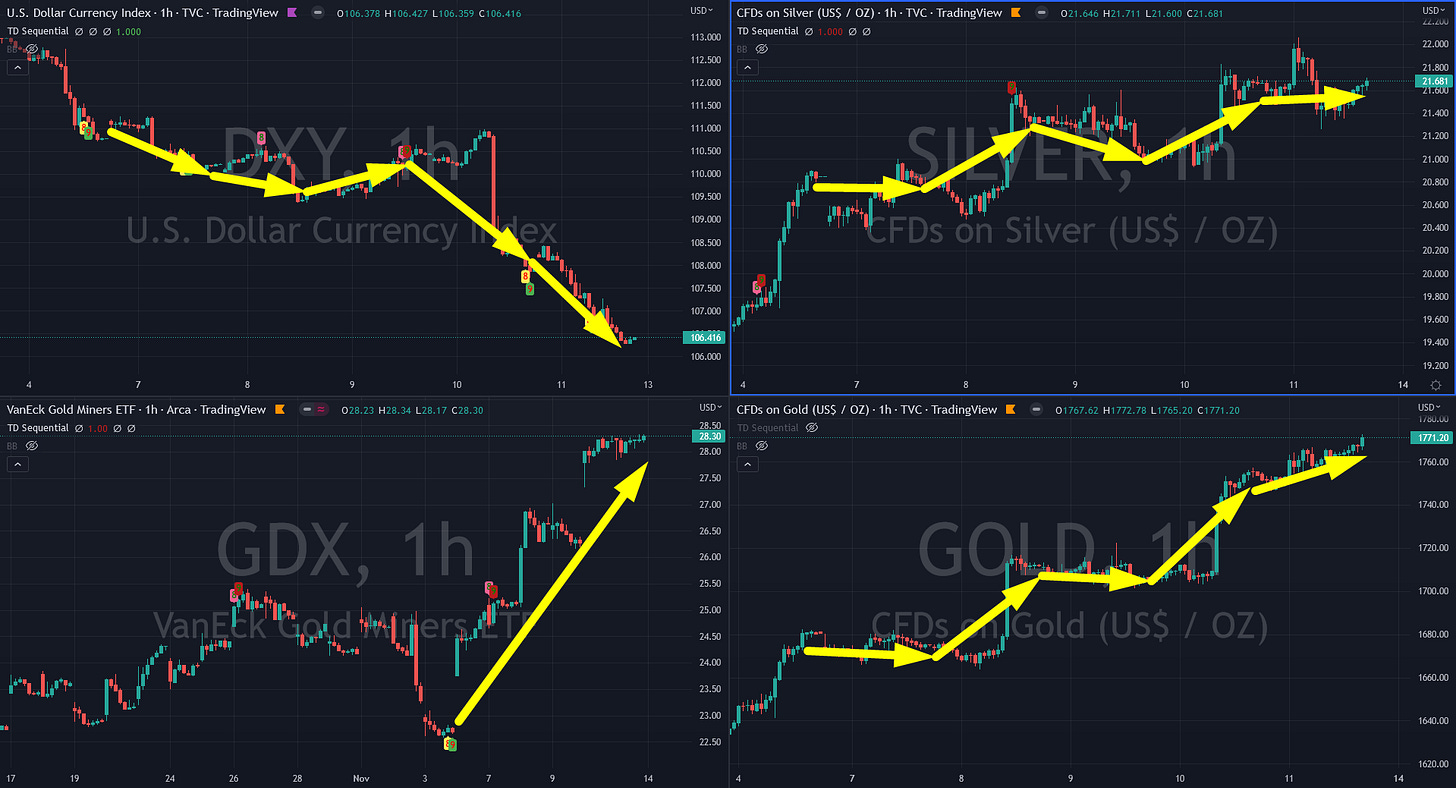
The DX extended Thursday’s plunge today for the biggest 2-day drop since March 2009, breaking below its 50- and 100-DMAs.
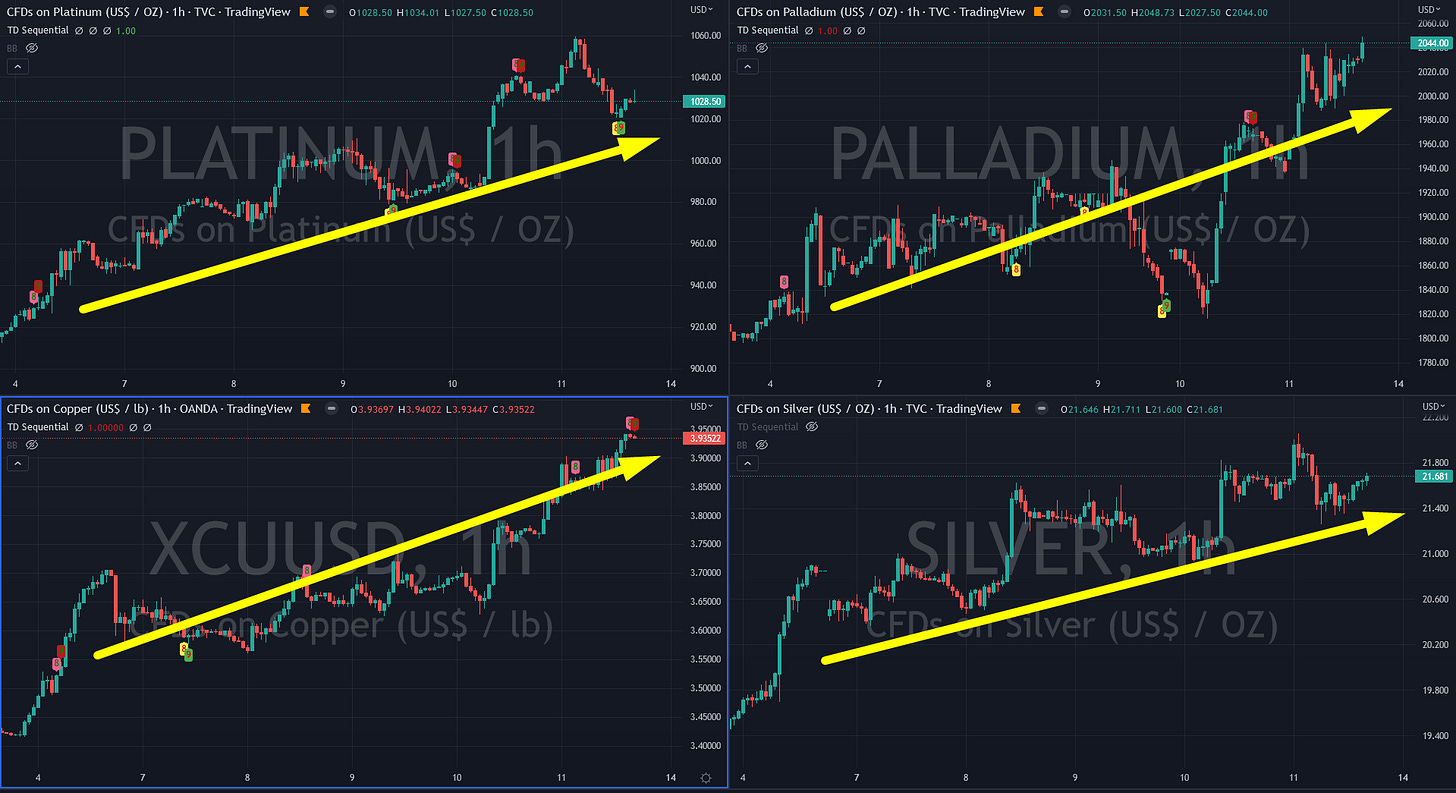
Gold soared this week, topping $1770 - its highest in 3 months. This was gold's best week since March 2020.
Oil ended the week lower, despite gains in the last couple of days on the back of China possibly easing its Zero-COVID strategy
Bonds:
Rate hike trajectories were dovishly lower on the week.
US Treasuries were aggressively bid this week with the belly down 45bps at the Thursday close, indicating the inversion may be topping as rate hike aggressiveness subsides
Crypto:
Stocks and crypto had become increasingly correlated once again in recent weeks. But the last two days, thanks to FTX contagion, have sparked a major decoupling.
Cryptos were a bloodbath this week after SBF and his girlfriend were exposed. Bitcoin & Ethereum were down over 20% on the week.
H/t Zerohedge for data and some graphics.
2. Research:
GoldFix: Gold & Silver Bullish Drivers from here to EOY
GS- Positioning for the Inflation target going from 2% to 3%- Oil, Gold, and EM currencies
JPM: FTX fallout
BBG: gold versus Oil in 2023
BOA- Hartnett’s “Rent the pivot, own the rotation” ( buy stocks for the rally, but avoid technology longer term). FANG STOCK DERATING JUST BEGINNING
3. Week’s Analysis/Podcasts:
Goldman: Revenge of the Old Economy (Oil, Copper, Silver)- ZH Version
CPI Prep: Metals Scenarios Today are an Indication of Weak Shorts
Goldman on Gold: "It's The Fed vs [BRICs] Central Banks" Now- ZH Version
Gold: Sell Pressure, Market Dynamics, and more- podcast on mystery Gold buying
That Time a Billionaire Self-Described His Crypto Biz as a Scam
4. Charts:
Metals and DX

Metals/PGMs
Energy
Forex
5. Calendar
MONDAY, NOV. 14
11 am NY Fed 1-year inflation expectations Oct. -- 5.7%
11 am NY Fed 5-year inflation expectations Oct. -- 2.2%
TUESDAY, NOV. 15
8:30 am Producer price index, final demand Oct. 0.4% 0.4%
8:30 am Empire state manufacturing index Nov. -5.0 -9.1
11 am Real household debt (SAAR) Q3 -- 0.8%
11 am Real mortgage debt (SAAR) Q3 -- 0.3%
WEDNESDAY, NOV. 16
8:30 am Retail sales Oct. 1.2% 0.0%
8:30 am Retail sales excluding vehicles Oct. 0.6% 0.1%
8:30 am Import price index Oct. -0.5% -1.2%
9:15 am Industrial production Oct. 0.2% 0.4%
9:15 am Capacity utilization rate Oct. 80.4% 80.3%
10 am Business inventories (revision) Sept. 0.5% 0.5%
10 am NAHB home builders' index Nov. 36 38
THURSDAY, NOV. 17
8:30 am Initial jobless claims Nov. 12 229,000 225,000
8:30 am Continuing jobless claims Nov. 5 -- 1.49 million
8:30 am Building permits (SAAR) Oct. 1.50 million 1.56 million
8:30 am Housing starts (SAAR) Oct. 1.41 million 1.44 million
8:30 am Philadelphia Fed manufacturing index Nov. -6.0 -8.7
FRIDAY, NOV. 18
10 am Existing home sales (SAAR) Oct. 4.32 million 4.71 million
10 am Leading economic indicators Oct. -0.4% -0.4%
Main Source: MarketWatch


