Housekeeping: This is long. You’ve been warned
Some quotes:
Highers Lows in Oi and Price with shorter cycle duration= Event Hoarding..
And they’re baaaaaack..banks must be shitting a brick now as
FOMC, bullish as it was, triggered profit-taking but funds starting buying it back up 2 days later. That is predictive of things between now and the election
The week should start higher based on how market reacts first few days after 20k buy ins.
The one thing that will trigger some selling without an event will be if we bump up against OI highs
Bank Swap Dealers are not making option markets now
The Citadel cavalry will come in soon, if for no other reason, to make money. The banks not doing their job projects weakness in US capital markets
TL/DR:
Funds added longs. Banks added shorts
Banks are at their ATH short positions with OI not near its ATHs yet.- Producers are not selling like they used to
Banks continue to show almost no option exposure- check GLD for fund playing now
Net Fund positions are now over 55% of total OI which is higher than the Covid peak. This kind of jumps out and is consistent with the bank short side mirroring it.
Swap Dealer Net Positions are short approx 258k which is at or above recent ATHs
The full commercial (Swap Dealer plus users) net short position at 336k is the 2nd highest of all time achieved during Covid era.
read the footnote1
CoT Analysis for Gold
Covers data from activity between Sept 10 and 17 inclusive
Weekly Price Change:
UP $53.00 from the 9/9 $2516 close to the 9/17 $2569 close
LOW= $2501 on 9/10 intraday
HIGH= $2590 on 9/16 intraday
Breakdown by Day
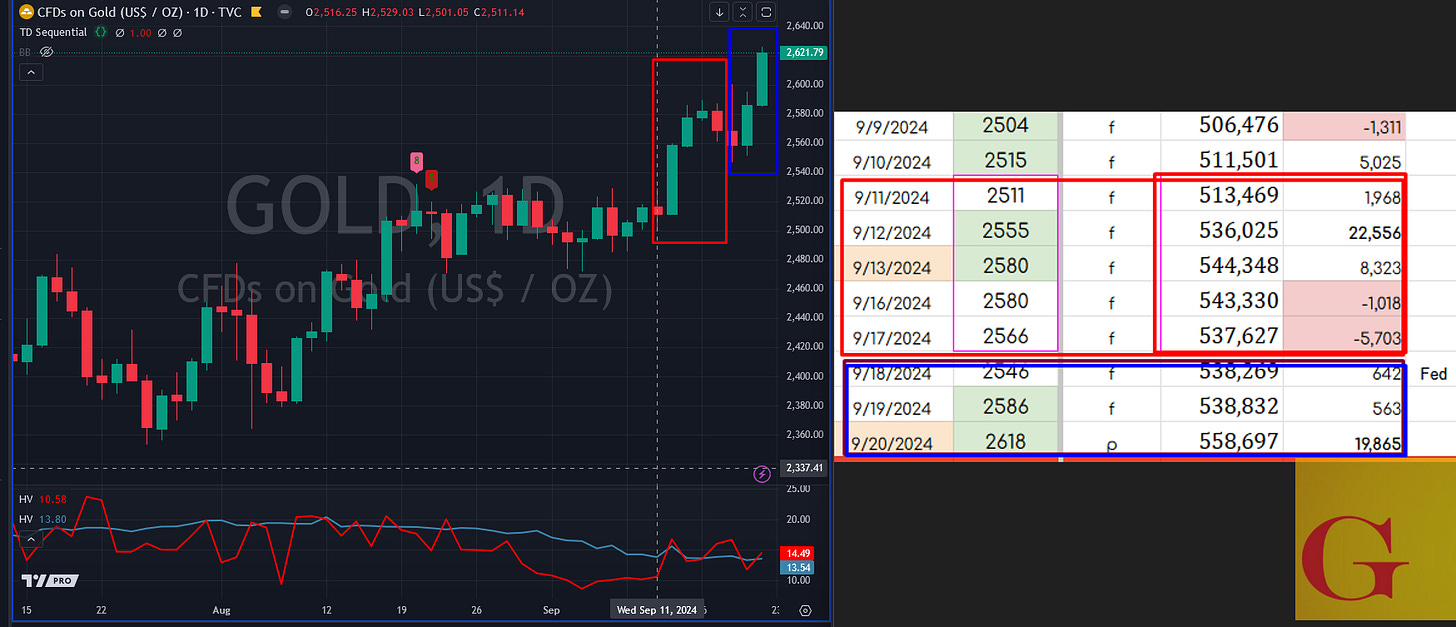
Overview: Trend/Normal Variation Week with Oi higher…
Day 1:
Red candle, down day.
Normal day, near doji OI up 2k.
Suggests: Nothing. new shorts, new longs..
Comment: Someone bt the dip, someone sold the rally noise by B-players
Day 2 :
Green candle, up day
Perfect Trend day higher-
Oi up 22k.. (another one comment on this)
Suggests: Long macro funds add to positions
Comment: PPI came in hot IIRC.. noone cared.. everything rallied. all buy predicting a 50bps rate cut. they were waiting for entry liquidity. Data point itself did not matter.
Day 3:
Green candle, up day
Almost Trend day..
Oi up 8.3k
Suggests: extension of Day 2
Comment: none
Day 4:
Green candle, up day
Normal variation lower? (long wick relatively speaking)
OI: down 1k
Suggests: strong hands to weak hands ( small buyers and bigger sellers loom and new shorts probably
Comment: none except this is classic short term, (and in past markets), longer term top behavior. This is not Gold-Classic however
Day 5:
Red candle, down day
Normal day
OI: down 5.7k
Suggests: orderly selling and fund liquidation
Comment: if volume was heavy, then also suggests new shorts getting in
Post Report: Day 6 to 8
Day 6:
Impulsive buying meets massive profit taking the mirror behavior of the PPI day. market worked higher all day as last minute people bought…… initial reaction was up.. then wooosh.. OI tells the tale JUST LIKE STOCKS
Day 7:
Cooler heads return. Big up day, normal day.. but OI nowhere. Strongly suggests profit taking into new buying
Day 8:
And they’re baaaaaack.. 20k Oi added.. re-looking at day 7 now.. this suggests they were buying there as well .. implies flat OI in rally not as bearish as it used to be at all.. banks must be shitting a brick now


