Housekeeping: Good Afternoon
TL; DR
In Presidential Elections voter preference is historically best measured by Consumer Sentiment
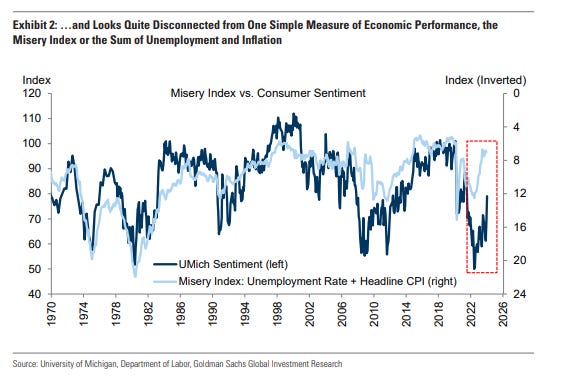
Currently, the historically robust correlation between actual Economic Data and Consumer Sentiment is broken
If Consumer Sentiment does not improve, Biden’s chances will worsen
Three states in which Biden lags due to his low Consumer Sentiment are key swing states in November.
Background
This Presidential election is shaping up to be about consumer sentiment. From Election 2024: Biden Gains Ground on Trump last week:
We believe as the election nears the economy will matter even more in voting decisions. Divided electorate aside, Biden needs to get his base out, and to do that he must motivate them via good economic numbers.
Goldman sees this and notes that the three states most important in this regard are Michigan, Ohio and Pennsylvania.
Consumer Confidence and the 2024 Presidential Election
[All GoldFix Comments and analysis Footnoted]
Authored by Tim Krupa for Goldman Sachs
The US economy is performing well: real GDP grew over 3% last year, real disposable income rose over 4%, the unemployment rate is just 3.7%, and inflation is slowing sharply. Yet consumer confidence and Americans’ assessment of the government’s economic policies remain clearly below pre-pandemic levels.
Exhibit 1 shows that all measures of consumer confidence remain noticeably below their pre-pandemic levels, despite an uptick in December and January. And Exhibit 2 shows that the level of confidence is surprising when compared to at least one very simple measure of economic performance, the so-called Misery Index or the sum of the inflation and unemployment rates.
[ Footnote 1: On Sentiment/ Misery Correlation Analysis1 ]
[ Footnote 2: Government Expectation Analysis2 ]
This Analyst explores why Americans still appear to be judging the economy and the government’s economic performance more harshly, how their views might continue to change heading into November, and what economic outcomes will matter most for the presidential election.
Household Income and Economic Well-Being Since the Pandemic
How have American households fared economically during the pandemic years? Because real income initially rose far above trend due to pandemic stimulus then normalized, the answer is partly a matter of perspective. Despite the inflation surge of recent years that has left the price level significantly above the pre-pandemic trend, the level of real income is now close to trend (Exhibit 3, left).
And on a cumulative basis, real income has actually been well above trend over the last several years, especially for lower-income households for whom pandemic fiscal transfers represented a larger share of income and wages rose more rapidly (Exhibit 3, right).
[ Footnote 3: Expectation mgt and the “real”3 ]
But we have also often found in the past that recent changes in economic conditions also weigh heavily on voters’ minds. This is likely why, for example, fiscal policy turns more expansionary during election years, especially in emerging market economies, as our global economics team has shown. In aggregate, household real disposable income has continued to grow at a strong pace over the last year, but lower-income households have experienced weak income growth in the last two years from a very elevated starting point in 2020 and 2021 that was boosted by temporary pandemic transfer payments.
All three of these perspectives—the cumulative performance, the current level, and the growth rates—could affect confidence and ultimately voting.
Confidence and the Economy: Is Perception at Odds with Reality?
Americans appear to be judging the state of the economy and government economic policy more harshly than usual
[Footnote 4: Trust, Expectations, and a sense of a declining future4.]
We find that contemporaneous economic conditions—such as the unemployment rate, income growth, GDP growth, inflation, and other indicators—explain survey-based perceptions of current economic conditions from the Conference Board’s consumer confidence survey and assessments of government economic policy from the University of Michigan survey quite well historically, as shown in Exhibit 5.
Why Hasn’t Confidence Recovered?
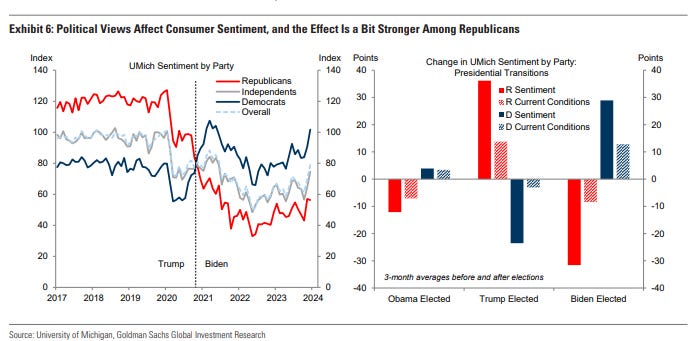
We see two likely explanations for why confidence has not recovered. First, there appears to be an asymmetry between the magnitude of Republican and Democratic bias in survey-based measures of confidence. Confidence tends to drop off sharply among supporters of both parties when control of the White House switches to the party they oppose, but the effect appears to be somewhat stronger among Republicans in recent elections, as Exhibit 6 shows.
[Footnote 5: Correct; and the driver is economic, not politics5 ]
Second, frustration with past high inflation appears to depress confidence for a while, perhaps because consumers continue to find price levels unreasonable for some time. For example, the left side of Exhibit 7 shows that confidence only began to recover during the Volcker disinflation when year-on-year realized headline CPI inflation and year-ahead inflation expectations had fallen below 4%, though it is hard to disentangle the lingering hit to confidence from high inflation with the impact of the recession in 1981-1982.
[Footnote 6: Good analog with some potentially important differences6]
More broadly, the right side of Exhibit 7 shows that our statistical estimate of the impulse from inflation fluctuations to confidence is also fairly slow moving. It implies that the negative impact of the recent inflation surge on confidence peaked earlier this year, has only faded modestly so far, and will fade meaningfully further but not fully by election day if our inflation forecasts are right.
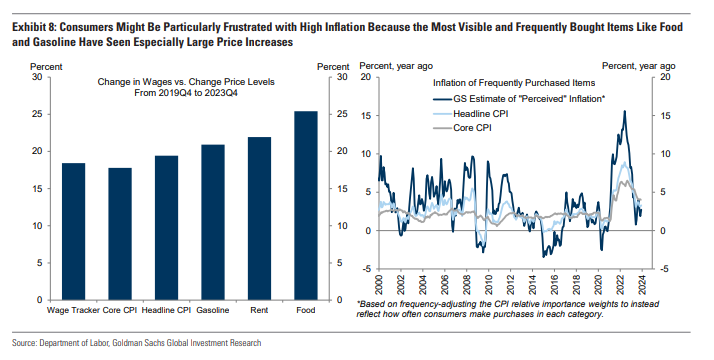
In fact, the impact of higher inflation on confidence might be even larger than the historical relationship implies because items with the greatest salience for consumers’ perception of inflation experienced especially large price increases over the last few years, as shown on the left side of Exhibit 8.
[ Footnote 7: Important difference between Volcker era and now7 ]
Other studies have found that items consumers buy most often, such as gasoline and frequently purchased food products (e.g., milk), have an outsized impact on perceptions of inflation, relative to their weight in the consumption basket. The right side of Exhibit 8 illustrates our best guess of how inflation may have been perceived by consumers, based on our estimates of how frequently items are purchased. While this “perceived” inflation index outran other measures in recent years, it has also slowed even more sharply in recent months.
[ Footnote 8: The most important item is Gasoline. The problem is ESG policy8]
Consumer Confidence and the November Elections
[ Footnote 9: If consumer confidence continues to increase, more than anything, this will increase Biden’s chances of winning. The Goldman analysis boils it down to 3 states that matter more than any other9 ]


