Housekeeping: The video discusses managed money’s lack of exposure to Gold, their options positions, and what to do when the market moves again. All is done in context of how to read these reports quickly and efficiently for market analysis. PDF and follow along transcription attached.
For the Gold Commentary:
9:42 to 12:45
19:00 minutes onward
Gold CTA Bank Report Breakdown
MBA level Masterclass on How to Read the BNP CoT Report
Video Contents
Intro
Chart Overview
Complete Gold and Silver Analysis
***THIS IS ALL IN THE VIDEO***
Gold and Silver Managed Money Report
What it tells us for the metals
How to read these things
Walk Through the key charts and how to read them
Read and comment on an actual report
What stands out
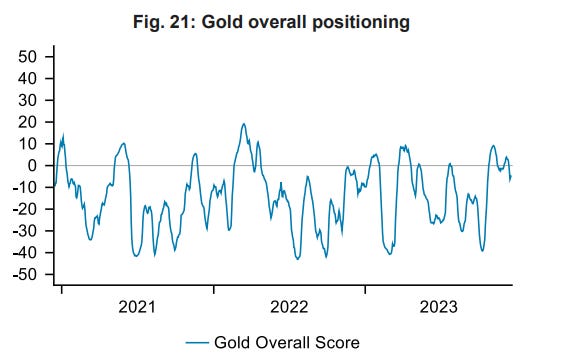
POSITIONING SCORE
The positioning scores in Figure 1 are percentiles based on the prior five years of data, rescaled to give a value between −50 and +50. Values above 40 and below −40 represent extreme positions (90th and 10th percentiles). For example, interpret a score of −27 by adding 50 to get 23, indicating that 23% of observations over the past five years have been below the current observation.
OVERALL SCORE COMPONENTS
GOLD OVERALL & COMPONENTS
SILVER OVERALL & COMPONENTS
MM: Commitment of traders as a proxy for US-based hedge-fund activity
Trend: Technical measure of the strength of momentum- ADX or something similar
Curve: The degree of backwardation in the futures market- Base, Silver, Oil
Skew: 110–90% call-put skew to indicate options market sentiment - option activity for sentiment
Pressure: Measure of broad market price pressure by evaluating prices and open interest jointly- pressure up or down, divergence concept, stochastic concept


