Weekly: Structural Stagflation and Anti-Goldilocks
Russian sanctions are like the Iranian Oil embargo. Now, as back in the 1970’s, stagflation is facilitated and possibly cemented by global governmental policies.
Housekeeping: Anyone who signs up right now gets a free premium week as a trial run. If you get something out of it, pls support it. Subscribe here Thank you.
Founder’s Class : 3 p.m. SUNDAY. CoT , Deep dive into what Zerohedge is talking about on their Zoltan stuff, Metals Basis for directional bias, and Market prep chat. Zoom Link here: Password: (usual one). See you then!
SECTIONS
Market Summary: weekly recap
Technicals: active trading levels
Podcasts: GoldFix and Bitcoin
Calendar: next week
Charts: related markets
Premium divider
Analysis
Research
1. Market Summary
After this war is over, …and Bitcoin (if it still exists then) will probably benefit from all this
We take this to mean that Bitcoin, if not totally squashed by governments for the majority of people, will be one of the primary beneficiaries of this horrible path we are on now. The other being physical gold and silver.
Hello: Stocks, bonds, and commodities were all hit hard this week as financial conditions tightened and geopolitical risks surged. Friday was laughable.
Friday morning’s report warned: Trading on the headlines is fine if that is your thing. But the headlines are all click bait. Words mean sh*t right now. The subsequent trading day was a great example of that. Hope sprung eternal until it didn’t.
A throwaway line from Putin that some ‘advances were made in negotiations’ sent stocks to the highs of the day as we were doing the GoldFix podcast. But then a dismal U-Mich sentiment print along with more sanctions, more threats and finally headlines that Russia will source weapons to Belarus, sent stocks to the lows of the day. Nasdaq swung from up 2% to down over 2% on the day.
Volatility was lower, It’s All Good Man
This will continue until the amateurs have given all their money to the pros. Stay away unless you are one. However volatility is an ally to long term investors and stackers looking for good spots to step in.
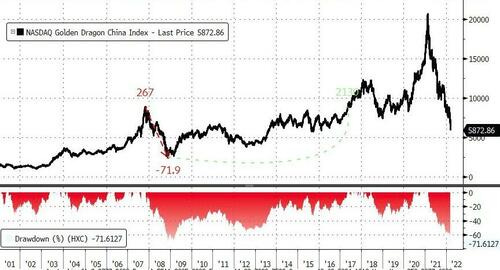
Nasdaq sent everything red for the week and was the biggest loser, down over 3%. Could be worse... could be China tech! Now down over 70% from the highs
*Some content in this section courtesy of Zerohedge by permission only*
From the record highs in November, global bond and stock markets are down $18 trillion.
Sectors
Energy did well again
Consumer defensives were indefensible1… sorry
Gold shares were fine, but still much weaker than the metal itself
Tech was hammered.
Pfizer did well.
Commodities
see chart section for more graphics
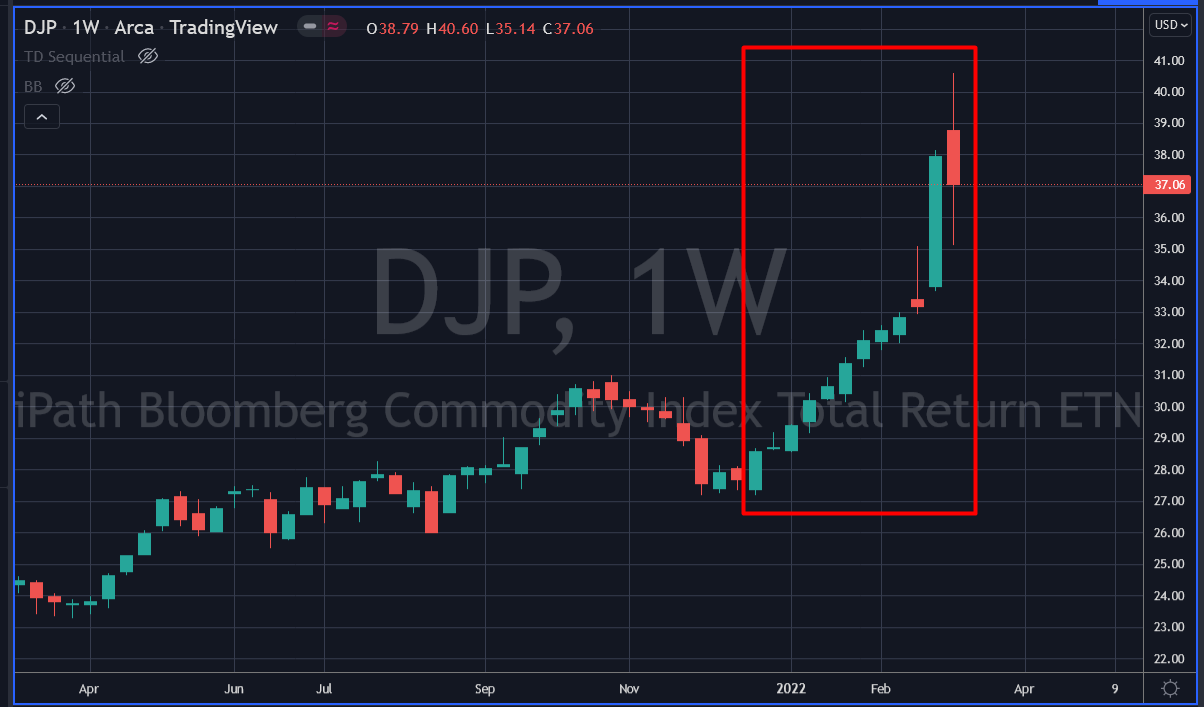
Commodities suffered only their second loss in the last 12 weeks
Wheat was slammed
Crude and Copper were dumped
PMs managed to cling to gains amid the chaos.
Gold fell back below $2000 from its midweek spike.
Gas prices at the pump rose to a record $4.32/gallon.
Bonds
Bonds were not exciting but consistent
The Treasury yield curve is screaming 'Fed Policy Error Imminent' but to be fair.. not raising is also a policy error. Rock and a hard place of their own doing.
the entire curve flattened - bellies disappeared
7s10s joining 20s30s in inversion
5s10s getting very close to inverting
Curve Inversion is Bad Right Now
The concept of inversion means recession is very imminent. For reasons we talked about in past podcasts- It is pretty predictive. When short term rates are higher than long term rates, investors keep their money in cash for the higher rate. Meanwhile longer term rates drop from buyers believing that stocks aren’t going to go up until the Fed eases. So they park their money in bonds.
These usually happen at the end of an inflatioanry hiking cycle. We are likely at the beginning of one. So either:
the Fed is hiking after we are already in a recession- ZH identified error
the curve is telling you inflation has much father to go- error of not hiking
a combination of the two.- chronic stagflation
Or the beginning of a very short hike cycle.- They will hike to ease
something we havent thought of yet- unpossible
Our money is on #3. Why? Because the Fed cannot do right by the American public now. Whatever they do to fix one side of the recession/inflation problem will exacerbate the other side. So they will do both and neither.
Since the world is now split along financial versus physical assets, their ability to manipulate both sides is greatly diminished by their own hand. Which brings us to the opposite of the Goldilocks economy. Where no matter what is done, the porridge is both too hot and too cold simultaneously. That is elaborated on in section 6. Analysis below this week.
GoldFix Friday WatchList:
Complete Watchlist Here
2. Technical Analysis
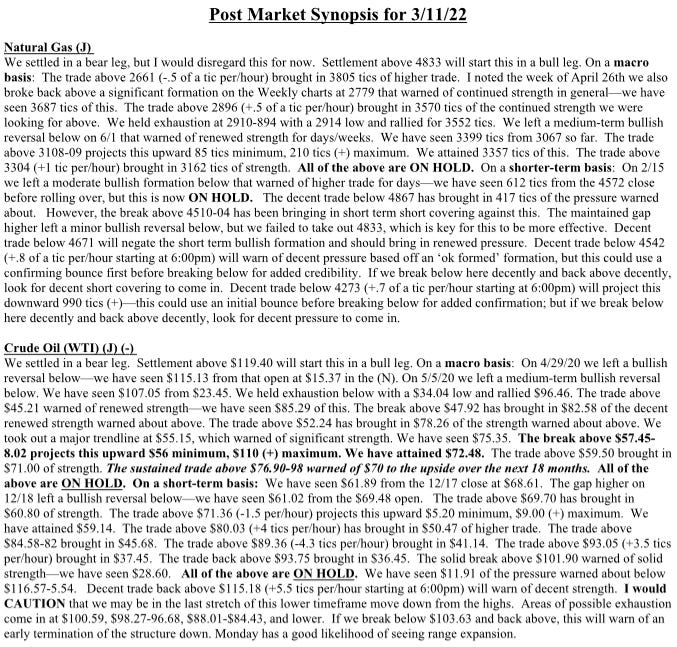
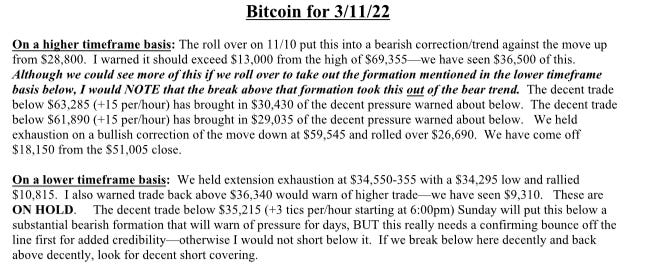
Report Excerpts Courtesy MoorAnalytics.com
GoldFix Note: Do not attempt to use price levels without symbol explanations or context. Moor sends 2 reports daily on each commodity they cover. The attached are non-actionable summaries.
Gold
TECHNICALLY BASED MARKET ANALYSIS AND ACTIONABLE TRADING SUGGESTIONS Moor Analytics produces technically based market analysis and actionable trading suggestions. These are sent to clients twice daily, pre-open and post close, and range from intra-day to multi-week trading suggestions. www.mooranalytics.com
Energy
Bitcoin
Go to MoorAnalytics.com for 2 weeks Gold, Oil, and Bitcoin reports free
3. GoldFix and Bitcoin Podcasts
4. Calendar
Some upcoming key data releases and market events.
MONDAY, MARCH 14 None scheduled
TUESDAY, MARCH 15
8:30 am Producer price index, final demand Feb. - -1.0%
8:30 am Empire state manufacturing index March -- 3.1
WEDNESDAY, MARCH 16
8:30 am Retail sales Feb. -- 3.8%
8:30 am Retail sales excluding motor vehicles Feb. -- 3.3%
8:30 am Import price index Feb. -- 2.0%
8:30 am Import price index excluding fuels Feb. -- 1.4%
10 am NAHB home builders' index March -- 82
10 am Business inventories (revision) Jan. -- 1.1%
2 pm FOMC announcement on fed funds rate -- 0.0%-0.25%
2:30 pm Fed Chair Jerome Powell news conference
THURSDAY, MARCH 17
8:30 am Initial jobless claims March 12 -- N/A
8:30 am Continuing jobless claims March 5 -- N/A
8:30 am Building permits (SAAR) Feb. -- 1.90 million
8:30 am Housing starts (SAAR) Feb. -- 1.64 million
8:30 am Philadelphia Fed manufacturing survey March -- 16.0
9:15 am Industrial production index Feb. -- 1.4%
9:15 am Capacity utilization rate Feb. -- 77.6%
FRIDAY, MARCH 18
10 am Existing home sales (SAAR) Feb. -- 6.50 million
10 am Index of leading economic indicators Feb. -- -0.3%
Main Source: MarketWatch
5. Charts
Dollar Index
Gold
Gold for Scale
Silver
Silver for Scale
Bascially normal week. Welcome to the show Gold!!
Wheat
Wheat for Scale
Oil
Oil for Scale
Charts by GoldFix using TradingView.com
Zen Moment:
Russia reposnds to sanctions, helps the US too!
Disclaimer:
Nobody is telling you to do anything here. Anybody who tells you to do something without first intimately knowing your personal situation is irresponsible at best and manipulative at worst. Anyone who acts on other people’s opinions without first doing an inventory of their own situation shouldn’t be surprised if they lose money.
6. Premium: Anti-Goldilocks Economy
A Goldilocks economy is an economy (see 1980 to 2007) that is neither too hot nor too cold, in other words sustains moderate economic growth, and that has low inflation, which allows a market-friendly monetary policy. The name comes from the children's story Goldilocks and The Three Bears.- Source
Bottom line: They could lower rates even while inflation was dropping from historic highs.
The Goldilocks economy was just right. Rates were dropping while inflation was easing. Technological innovations created more efficient means of production, which generated even more dis-inflation.
Too Hot and Too Cold
The opposite of the Goldilocks economy is where no matter what is done, nothing is right.… Continues at bottom
7. Premium: Analysis
Inflation, the economy, and CTA stuff beneath the fold


