Housekeeping: Many will be receiving GoldFix Weekly for the first time. It is different than the dailies. It is more like Barron's used to be. Content touches many areas of markets. The index may help.
**This Week: Assesments of Gold vs the Fed bias, the real Energy inflation yet to come, and why it’s 1975 all over again
SECTIONS
Market Summary: Earnings Season
Technicals: Oil toppy, Gold bottom-y
Podcasts: Oil
Calendar: FOMC and More
Charts: PGMs look suspicious
Analysis: 11 posts
Research: Gold, ESG Energy, Home prices
1. Market Summary
Stocks went down on bad news Friday which is not considered normal these days. They went out very weak on the back of both recessionary fears being warranted by PMI data, and SNAP reporting a slowdown in ad revenues. Bonds rallied, commodities dropped, and chances of harsh rate hikes also decreased.
Indices held on to gains for the week
Small Caps and Big-Tech best performers
Dow the weakest
So why did stocks drop Friday? What is this blasphemy that seems to imply recession risk is bearish, when we’ve been told that bad news is good news? Earnings season is the reason.
EARNINGS SEASON
The bad news equals good news behavior is based on predicting actions by the Fed. Under that mindset recessionary risk rising means a more lenient Fed policy. But every once in while the market actually looks at earnings; and SNAP gave a preview of this earnings season.
This can cause weaker hands to sell on the news, and absent Fed hand-holding, stocks will drop. That may continue until at least next Wednesday when the Fed ingratiates us again with more economic wisdom. So every once in a while markets behave as you think they should.
EUROPE REVERSES
Major US indices also accelerated losses after Europe closed Friday, itself a reversal from recent weeks when we had seen the selling being sourced from Europe but stopping after Europe closed almost daily. The main difference between than and now is the ECB met on Friday; that may have signaled a reversal of behavior on investor part.
H/t Newsquawk and Zerohedge for data and some graphics.
Sectors:
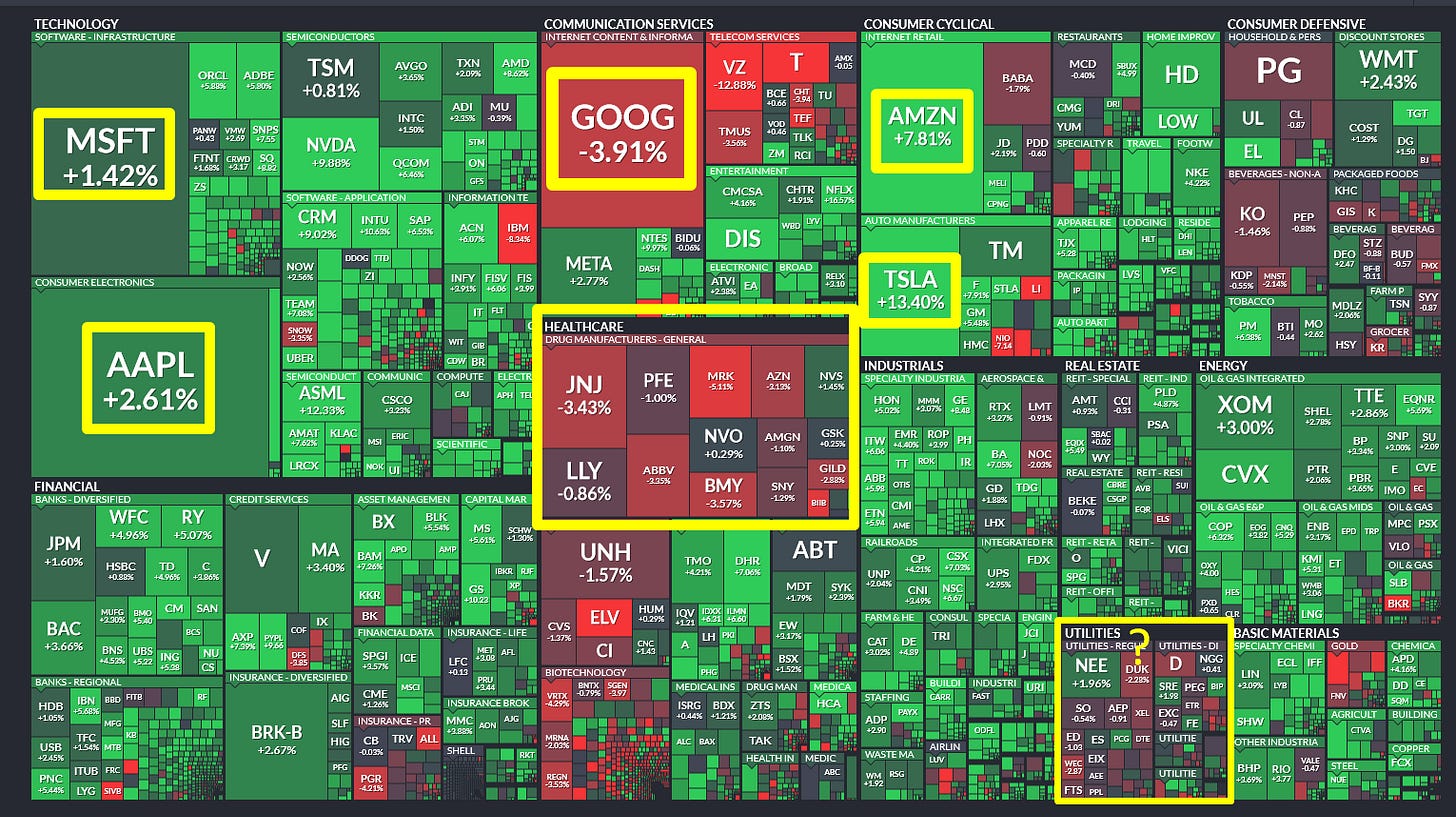
Utilities were losers on the week, which is curious when bonds and banks rally
Consumer Discretionary best performer
Tech and Energy stocks also did well
Last week Europe was the seller with US the buyer. That reversed post the EU rate hike
Commodities:
The dollar was weaker on the week, back near 3-week lows
People starting to crow about gas prices coming down. Maybe they should start solving the coming problem. A Cold winter in Europe means high Nat Gas prices in US now. Supply-side sanction/war inflation is global.
Gold ended the week lower but the early week weakness prompted a nice bounce back above $1700 due to CTA covering. But Silver could not hold gains even with Copper stronger.
Oil prices were marginally lower on the week
Bonds:
Bonds were aggressively bid Thursday and Friday, sending yields from +15bps to -15bps in 2 days.
30Y Yields tumbled back below 3.00% to their lowest since May.
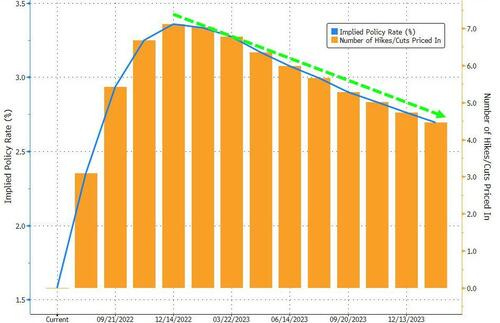
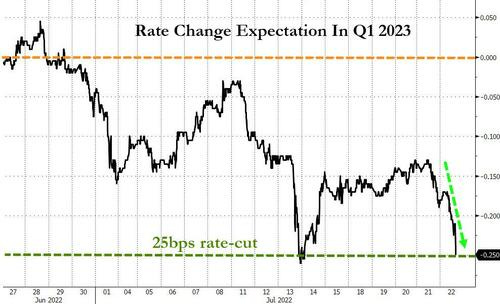
Terminal rate for Fed Funds tumbled to 3.358% in Dec 2022
Then rate-cuts (believe it or not) begin.
Crypto:
Cryptos were also aggressively bid this week with Ethereum the big outperformer (up 25%) and Bitcoin gaining 10%.
Ethereum rallied back above $1600, its best week since Sept 2021
The expectations of a successful Ethereum merge combined with some feeling the worst news is out on Bitcoin blowups and rescues by FTX are likely what is driving this rally.
2. Technical Analysis
Report Excerpts Courtesy MoorAnalytics.com
GoldFix Note: Do not attempt to use price levels without symbol explanations or context. Moor sends 2 reports daily on each commodity they cover. The attached are non-actionable summaries.
Gold
TECHNICALLY BASED MARKET ANALYSIS AND ACTIONABLE TRADING SUGGESTIONS Moor Analytics produces technically based market analysis and actionable trading suggestions. These are sent to clients twice daily, pre-open and post close, and range from intra-day to multi-week trading suggestions. www.mooranalytics.com
Energy
Bitcoin
Go to MoorAnalytics.com for 2 weeks Gold, Oil, and Bitcoin reports free
3. Podcasts
Oil Fix: Courtesy Moor Analytics
GoldFix Broadcasts HERE
Bitcoin Podcasts HERE
4. Calendar
Some upcoming key data releases and market events
MONDAY, JULY 25
8:30 am Chicago Fed national activity index June -- 0.01
TUESDAY, JULY 26
9 am S&P Case-Shiller national home price index May -- 20.4%
10 am Consumer confidence index July -- 98.7
10 am New home sales (SAAR) June -- 696,000
WEDNESDAY, JULY 27
8:30 am Durable goods orders June -- 0.8%
8:30 am Core capital equipment orders June -- 0.6%
8:30 am Advance report on trade in goods June -- -$104.3 billion
10 am Pending home sales index June -- 0.7%
2 pm Fed funds target rate -- 1.5%-1.75%1
2:30 pm Fed Chair Jerome Powell press conference
THURSDAY, JULY 28
8:30 am Gross domestic product, first release (SAAR) Q2 -- -1.6%
8:30 am Final sales to domestic purchasers (SAAR) Q2 -- 2.0%
8:30 am Initial jobless claims July 23 -- N/A
8:30 am Continuing jobless claims July 16 -- N/A
FRIDAY, JULY 29
8:30 am PCE inflation index June -- 0.6%
8:30 am Core PCE price index June -- 0.3%
8:30 am PCE price index June -- 6.3%
8:30 am Core PCE price index (year-over-year) June -- 4.7%
8:30 am Real disposable income June -- -0.1%
8:30 am Real consumer spending June -- -0.4%
8:30 am Nominal personal income June -- 0.5%
8:30 am Nominal consumer spending June -- 0.2%
8:30 am Employment cost index Q2 -- 1.4%
9:45 am Chicago PMI July -- 56.0
10 am UMich consumer sentiment index (final) July -- 51.1
10 am UMich 5-year inflation expectations (final) July -- 2.8%
Main Source: MarketWatch
5. Charts: Metal divergence means spreading is afoot
We believe there is some intercommodity spread trading going on here by the banks to keep margins down. Silver sold and gold bought. Palladium bought with Platinum and silver sold.
Gold: Higher on the week despite a Thursday slam
Silver: Weak despite Gold, Copper, and PGM strength
Palladium: Go figure
Platinum: Leads Palladium, but does not follow through.
Charts by GoldFix using TradingView.com
6. Analysis Recap:
This week’s Precious Metals, Energy, and Economics pieces by GoldFix
Friday:
Thursday:
Silver Buyer "Up To a Billion Dollars" in Coins - 50k views
Popular: Buyer of "Up To a Billion Dollars" in Coins Emerges- Zerohedge
Wednesday:
Podcast: Metals Spreads with Charts- 500 downloads
Tuesday:
Monday:
Popular: Oil: Biden Done, Heating Oil Season Looms Large- Zerohedge
Founders Podcast: Gold/Silver Backwardation and Triple Top Formations- 2,000 views
Sunday:
The EURO: "Empires based solely on political goals fail"- 15k views
Popular: EURO: "Empires based solely on political goals fail"- Zerohedge
7. Research:
This week brings assesments of Gold vs the Fed, the real inflation yet to come from Energy, and why it’s 1975 all over again
TD Bank on Gold and the Fed
Does Chair Powell fear Arthur Burns' policy error? Recession fears are rising as the Fed is set to continue raising rates into a slowing growth outlook. In turn, this has led market participants to turn their attention towards timing for a policy pivot.
After all, recession odds have historically led a change in Fed policy over the past several decades. However, the outlook for Fed policy today is blurred by the inflation regime which contrasts with the disinflation regime from which participants have extracted these historical analogies from. With inflationary impulses still broadening across the economy…
Continues at Bottom
Barclays Thinks Energy Transition Will Cost $150 Trillion
Decades of uninterrupted, affordable energy have come to an end following a sustained period of under investment. This will take time to fix and consumers of energy, in all forms, face a period of higher prices. With security of supply an issue for governments and consumers alike, we see an enhanced role for big energy.
We estimate that it would take close to a $150tn investment to transform the global energy system
This was written about months ago here but now it seems the other banks are finally picking up on it
More at Bottom
BOA Says 2022 Feels Like 1975
1974 vs 1975: that all said, flurry of better-than-expected inflation prints (plus less war & more China stimulus) roadmap to more conclusive low in credit & stocks;
price action of '22 has mirrored stagflationary 1974/75 in terms of absolute & relative asset performance (albeit at warp-speed – Charts 7-8);
The 1970s Quilt Revisited
….backdrop same, oil shocks, food shocks, monetary instability, fiscal policy indiscipline, industrial unrest, civil unrest, war; once inflation peaked late-74, Fed cut with credibility into 1975, stocks surged, and major bull markets in small cap, value, real estate began (without return of tech/Nifty 50 leadership of 1965-73)
ZH did a thorough premium piece here Friday
Continues at BottomZen Moments:
Triathlon: Skateboarding, Biking, Swimming


